RMBS TRADE
The final example of letting one get away is a trade that caused me to become too attached to an expectation, surrounded by hype over a patent infringement ruling. Rambus, Inc. (Figures 13.6 and 13.7 ) had sued NVIDIA Corp. for a violation of patent rights. Rambus had a very good case, and the overwhelming consensus was that the news would be in its favor. If so, it would be a financial shot in the arm for the company, the reflection of which would show up in the form of a quick boost in its stock price. The announcement was scheduled for Monday after hours.
Figure 13.6 An upside breakout is building.
RMBS, weekly, indicator set #13. Weekly characteristics of the trade set-up: • Inverted head-and-shoulders pattern (indicated by LS, H, and RS), portending an upside breakout. • An ascending triangle has formed in the area of the right shoulder. • MACD histogram and volume are sloping upward (indicated by arrows).
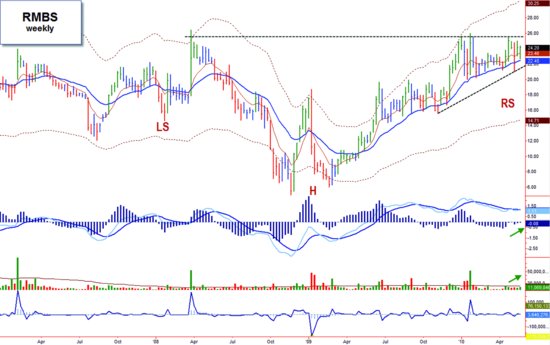
Figure 13.7 False upside breakout leads to a severe sell-off.
RMBS, daily, indicator set #8. Progress of the trade: • I entered long on a break above the down-trendline at 24.33. Prices continued to rise early in the day but then sagged back inside the triangle (bar A). • Prices gapped down at the open and weakened throughout the morning, triggering my stop at 23.14, for a 4.8 percent loss. Prices bounced off the up-trendline and surged in the afternoon ...
Get Fly Fishing the Stock Market: How to Search for, Catch, and Net the Market's Best Trades now with the O’Reilly learning platform.
O’Reilly members experience books, live events, courses curated by job role, and more from O’Reilly and nearly 200 top publishers.

