JTX TRADE
The next example of a trade that got away from me was JTX (Figures 13.4 and 13.5 ). I had made a nice spring Bottoms-Up Type II pattern trade five months earlier with this same stock, but this time it was the fall market season. Nevertheless, I had what I thought was the same pattern as before, which left me little doubt that I would get the same outcome. My expectation couldn’t have been further from the truth. I was using the wrong strategy for the season, which was my first mistake. It went downhill from there.
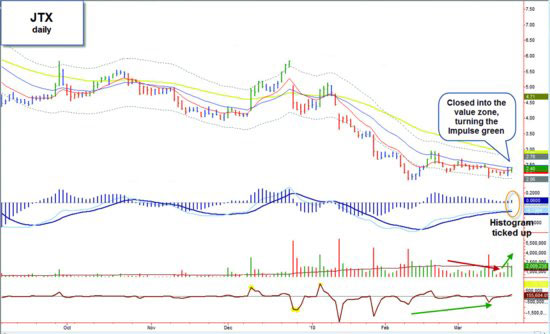
Figure 13.4 Ready for launch?
JTX, daily, indicator set #19. Daily characteristics of the trade set-up: • Bullish divergence of the Force Index (indicated by the green arrow). • The MACD histogram had ticked up, converting the Impulse from blue to green as prices closed into the value zone at the high of the day on the last bar.

Figure 13.5 Pattern change.
JTX, daily, indicator set #19. Progress of the trade: • I entered at the open at 2.34. The price sagged the rest of the day, changing the Impulse from green to red (bar A). • Prices continue to drop, making a new weekly low (bar B). I was stopped out the next day at 2.13, a tick below the low of bar B, for an 8.97 percent loss over four days. • Downward momentum builds, confirmed by volume (bar C).
The weekly chart had echoed the daily bullishness and had also displayed extreme volume the past ...
Get Fly Fishing the Stock Market: How to Search for, Catch, and Net the Market's Best Trades now with the O’Reilly learning platform.
O’Reilly members experience books, live events, courses curated by job role, and more from O’Reilly and nearly 200 top publishers.

