THE DECEPTIONS OF SYMMETRICAL TRIANGLES
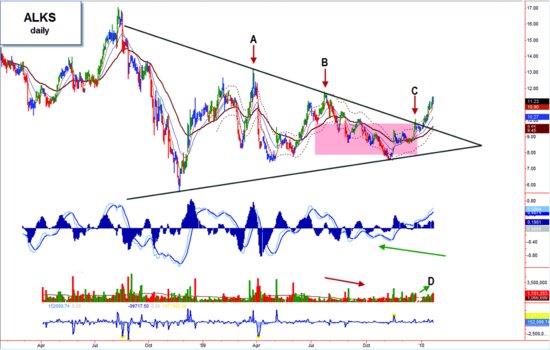
These patterns usually serve as continuation patterns, but you cannot take that for granted. Trading in the same direction as the trend prior to the triangle may seem like the thing to do, but symmetrical triangles sometimes mark the end of a trend, and a reversal follows. ALKS provides such an example (Figure 6.4).
FIGURE 6.4 Symmetrical triangle pattern.
ALKS, daily, indicator set #8. Compressing a chart makes it easier to see resistance and support as well as breakouts. Here we can see prices zigzag between the boundaries of a triangle, with pretty clear reversal points. When a rally stalls at a down-trendline (see areas A and B), it offers a great shorting opportunity. But look at what happened in area C. Instead of ricocheting off the trendline as before, prices broke through and soared in a new uptrend. Why did it occur this time but not before? We can see three clues: 1. Volume. As the triangle contracts toward the apex, volume typically diminishes. This tightening before the breakout is like the calm before a storm. A breakout is confirmed by high volume (area D). 2. Breakouts. They usually occur approximately two-thirds of the way to the apex (indicated by the highlighted area). 3. MACD. The MACD lines and histogram often contradict one another just prior to a breakout, as depicted in Figure 6.5.

FIGURE 6.5 MACD lines and histogram ...
Get Fly Fishing the Stock Market: How to Search for, Catch, and Net the Market's Best Trades now with the O’Reilly learning platform.
O’Reilly members experience books, live events, courses curated by job role, and more from O’Reilly and nearly 200 top publishers.

