MOVING AVERAGE CONVERGENCE-DIVERGENCE
Developed by Gerald Appel in the 1970s, Moving Average Convergence-Divergence (MACD) is one of the most popular technical indicators. It identifies trends and measures their momentum. Here is a brief description from Stockcharts.com:
Moving Average Convergence-Divergence (MACD) is one of the simplest and most effective momentum indicators. MACD turns two trend-following indicators, moving averages, into a momentum oscillator by subtracting the longer moving average from the shorter moving average. As a result, MACD offers the best of both worlds: trend following and momentum.
The standard MACD line is the 12-day EMA minus the 26-day EMA of closing prices. A 9-day EMA of this MACD line is called the Signal line. MACD histogram represents the difference between the two lines. The histogram is positive when the MACD line is above the Signal line and negative when it is below the Signal line (see Figure 2.23).
FIGURE 2.23 MACD components.
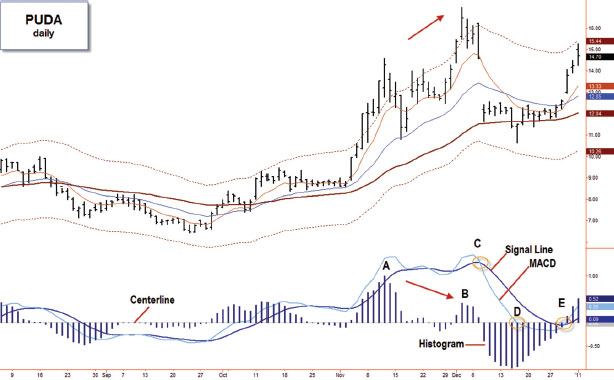
PUDA, daily, 8-, 21-, and 50-day EMAs, AutoEnvelope, MACD and Signal lines, MACD histogram, and a centerline. Here you can see a bearish divergence of MACD histogram (A–B), a bearish Signal line crossover (C), a bearish centerline crossover (D), and a bullish Signal line crossover (E).
MACD helps identify the trend of any trading vehicle and evaluate its momentum. It does this through three kinds of signals: ...
Get Fly Fishing the Stock Market: How to Search for, Catch, and Net the Market's Best Trades now with the O’Reilly learning platform.
O’Reilly members experience books, live events, courses curated by job role, and more from O’Reilly and nearly 200 top publishers.

