BULLISH AND BEARISH ENGULFING PATTERNS
These chart patterns occur when a short bar is followed by a larger bar whose opening and closing prices completely engulf the previous bar's range (Figures 2.3 and 2.4). On the second day, when prices open below the previous candle's high-low range and then close above that range, we have a bullish engulfing candle. When prices on the second day open above the previous day's high and close below its low, we get a bearish engulfing candle.
FIGURE 2.3 Bullish engulfing pattern.
The body of the second candle completely engulfs the first candle, from high to low. It calls for the uptrend to continue.
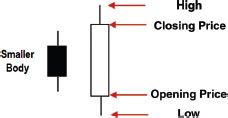
FIGURE 2.4 Prices plunge following a bearish engulfing candle.
PUDA, daily candlestick chart. Three days after the stock hit a new high, there was a very large bearish engulfing candle, suggesting a reversal of the uptrend. • A very short candle shows that the bulls are losing their power, while bears are putting up stiff resistance (bar A). • The final push by the bulls takes out the high of Day 1, but at the end of the day, the engulfing candle shows that bears scored a decisive win (bar B). • Bulls give up; bears go at full throttle (bar C).

The opening tick of a bearish engulfing candle or bar must be above the previous day's high, while ...
Get Fly Fishing the Stock Market: How to Search for, Catch, and Net the Market's Best Trades now with the O’Reilly learning platform.
O’Reilly members experience books, live events, courses curated by job role, and more from O’Reilly and nearly 200 top publishers.

