The Flash ActionScript Debugger
Debuggers have been around in other programming environments for years, but it is a necessary tool and a welcome addition to the Flash environment. We cover the Flash debugger only briefly, as it has been covered in depth elsewhere. The Flash debugger allows you to set up interactive debugging within the Flash movie. This allows you to interact with the code as it is executing—examining variables and stepping through the lines of code one by one to help you determine where a problem might exist. The debugger can also be used with a remote movie located on a web server. The movie will be retrieved and debugged locally in the Flash Player. More information on remote debugging can be found in the Flash online Help system under Help → Using Flash → Testing a Movie → Using the Debugger.
Using the Debugger
The Debugger panel becomes active when you choose Control → Debug Movie (Ctrl-Shift-Enter on Windows or Cmd-Shift-Enter on Macintosh). This effectively starts the movie in debug mode, allowing you to view the execution of code. The movie starts with the Debugger panel open at the first line of your script to await instructions, as shown in Figure 13-1.
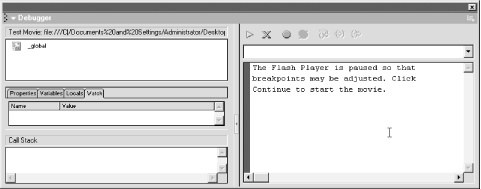 |
Having chosen the Debug Movie option, the first thing you’ll need to do is to set up a breakpoint. Breakpoints make the code execution “stop here.”
Tip
The ActionScript ...
Get Flash Remoting: The Definitive Guide now with the O’Reilly learning platform.
O’Reilly members experience books, live events, courses curated by job role, and more from O’Reilly and nearly 200 top publishers.

