SHAREHOLDER VALUE CREATION AND THE ROE MODEL: JCPENNEY VS. KOHL'S
Figures 5A-3 and 5A-4 summarize the financial ratios for two mid-market department stores, JCPenney and Kohl's, respectively, for 2008 and 2007, in a format consistent with the ROE framework. Figure 5A-5 compares selected ratios from Kohl's and Penney to those ratios computed across the members of their primary industry group, retail apparel and accessories.
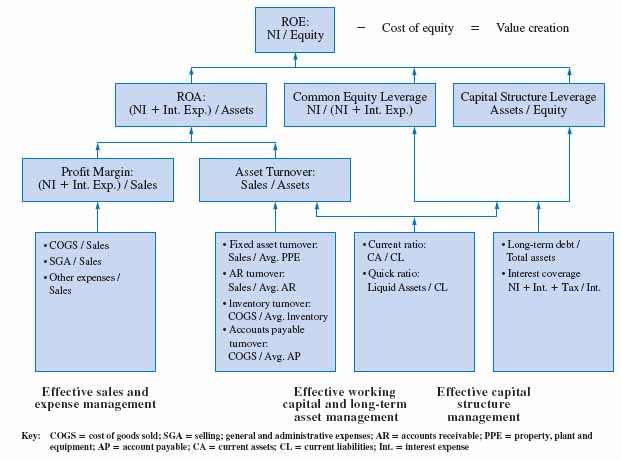
FIGURE 5A-2 Complete ROE model
Both companies performed profitably in 2008, a difficult and somewhat unique feat in the retail industry given the economic recession experienced during this time. Assuming an estimate of the cost of equity for each firm of 12 percent, both created wealth by generating returns in excess of this market standard. Both companies, however, generated lower returns in 2008 than in the previous year. As described below, the ROE model indicates that these companies generated their returns in different ways, and in a manner different from much of the industry.
JCPenney employs more leverage than Kohl's, using it to boost ROE; the company, in both 2007 and 2008, had lower profitability ratios but used higher capital structure leverage (CSL) to compensate for the lower returns. The 2.78 CSL ratio for Penney appears to be more aggressive than the 1.71 employed by Kohl's.
The more conservative approach to its capital structure taken by Kohl's ...
Get Financial Accounting: In an Economic Context now with the O’Reilly learning platform.
O’Reilly members experience books, live events, courses curated by job role, and more from O’Reilly and nearly 200 top publishers.

