7.8 The t-Distribution
In nearly all practical situations the standard deviation of the population that we sample from is unknown and has to be estimated from the data. Relying on the central limit effect we may assume that our sample mean ![]() is normally distributed and that its standard deviation can be estimated by
is normally distributed and that its standard deviation can be estimated by ![]() . Then the transformed variable:
. Then the transformed variable:
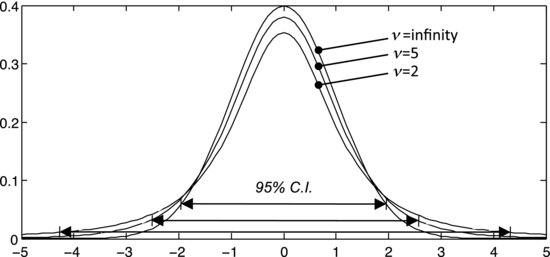
follows a so-called t-distribution. As previously mentioned, a larger sample gives a more reliable estimate of the standard deviation, so you are probably not surprised that the t-distribution depends on the number of degrees of freedom, ν, of the sample. This is illustrated in Figure 7.16, showing t-distributions for ν = 2, 5, and infinity. Note that they become wider and flatter when ν decreases, but the mean is always zero. The t-distribution's standard deviation is:
Figure 7.16 Examples of t-distributions with two, five and infinite degrees of freedom.

(7.14) ![]()
meaning that, as ν becomes large, σ approaches one and the distribution ...
Get Experiment!: Planning, Implementing and Interpreting now with the O’Reilly learning platform.
O’Reilly members experience books, live events, courses curated by job role, and more from O’Reilly and nearly 200 top publishers.

