Chapter 6. The Art of Dynamic Labeling
Up to this point, I've covered the major tools you can use to build basic dashboard components: pivot tables, charts, and conditional formatting. In this chapter, I focus on functionality that is less apparent — dynamic labeling.
Dynamic labeling is less a function in Excel than it is a concept. Dynamic labels are labels that change to correspond to the data you're viewing. With dynamic labeling, you can interactively change the labeling of data, consolidate many pieces of information into one location, and easily add layers of analysis.
In this chapter, you explore the various techniques that can be used to create dynamic labels.
Creating a Basic Dynamic Label
A common use for dynamic labels is labeling interactive charts. In Figure 6-1, I have a pivot chart that shows the Top 10 Categories by market. When the market is changed in the Filter drop-down list, the chart changes. Now, it'd be nifty to have a label on the chart itself that shows the market for which the data is currently being displayed.
Tip
Don't know what a pivot chart is? Feel free to take a gander at Chapter 4 for a discussion of pivot charts.
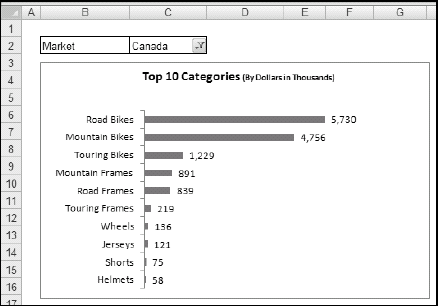
Figure 6-1. Interactive charts, such as this pivot chart, are ideal places to use dynamic labels that change based on current selection.
To create a dynamic label within your chart, follow these steps:
On the Insert tab in the Ribbon, select the ...
Get Excel® 2007 Dashboards & Reports For Dummies® now with the O’Reilly learning platform.
O’Reilly members experience books, live events, courses curated by job role, and more from O’Reilly and nearly 200 top publishers.

