Most people don’t need much convincing to use Excel, Microsoft’s premier spreadsheet software. In fact, the program comes preinstalled on a lot of computers, making it the obvious choice for millions of number crunchers. Despite its wide use, however, few people know where to find Excel’s most impressive features or why they’d want to use them in the first place. Excel: The Missing Manual fills the void, explaining everything from basic Excel concepts to fancy tricks of the trade.
This book not only teaches you how the program works, it also shows you how to use Excel’s tools to answer real-world questions like “How many workdays are there between today and my vacation?”, “How much money do I need in the bank right now to retire a millionaire?”, and “Statistically speaking, who’s smarter—Democrats or Republicans?” Best of all, you’ll steer clear of obscure options that aren’t worth the trouble to learn, while honing in on the hidden gems that’ll win you the undying adoration of your coworkers, your family, and your friends. Or at least your accountant.
Note
Although this book is written with Microsoft’s latest and greatest release in mind (Excel 2003), most of the concepts, features, tricks, and tips work equally well with Excel 2002 (the version of Excel released with Office XP). If you’re using Excel 2002, this book will still be useful because each chapter clearly spells out any differences you’ll encounter. The Mac version of Excel is covered in Office 2004 for Macintosh: The Missing Manual.
Excel and Word are the two powerhouses of the Microsoft Office family. While Word lets you create and edit documents, Excel specializes in letting you create, edit, and analyze data that’s organized into lists or tables. This grid-like arrangement of information is called a spreadsheet; Figure P-1 shows an example.
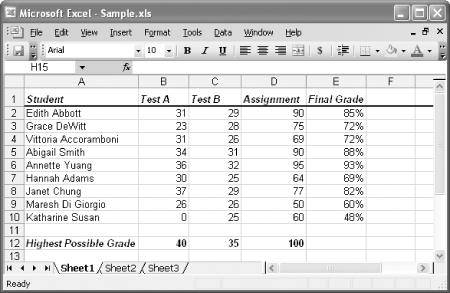
Figure P-1. This spreadsheet lists nine students, each of whom has two test scores and an assignment grade. Using Excel formulas, it’s easy to calculate the final grade for each student. And with a little more effort, you can calculate averages, medians, and determine which percentile each student falls into. Chapter 8 looks at how to perform these calculations.
Note
Excel shines when it comes to numerical data, but the program doesn’t limit you to calculations. While it has the computing muscle to analyze stacks of numbers, it’s equally useful for keeping track of the CDs in your personal music collection.
Some common spreadsheets include:
Business documents like financial statements, invoices, expense reports, and earnings statements.
Personal documents like weekly budgets, catalogs of your Star Wars action figures, exercise logs, and shopping lists.
Scientific data like experimental observations, models, and medical charts.
These examples just scratch the surface. Resourceful spreadsheet gurus use Excel to build everything from cross-country trip itineraries to lesson plans to logs of every Kevin Bacon movie they’ve ever seen.
Of course, where Excel really shines is in its ability to help you analyze a spreadsheet’s data. For example, once you’ve entered a list of household expenses, you can start crunching numbers with Excel’s slick formula tools. Before long you’ll have totals, subtotals, monthly averages, a complete breakdown of cost by category, and maybe even some predictions for the future. Or Excel can help track your investments and tell you how long until you’ll have saved enough to buy that weekend house in Las Vegas.
The bottom line is that once you enter raw information, Excel’s built-in smarts can help compute all kinds of useful figures. Figure P-2 shows a sophisticated spreadsheet that’s been configured to help identify hot-selling product categories.
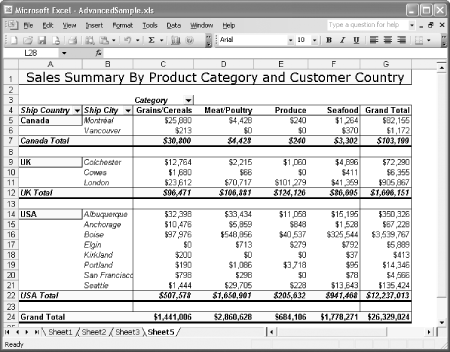
Figure P-2. This spreadsheet summarizes a company’s total sales. The information is grouped based on where the company’s customers live, and it is further divided according to product category. Summaries like these can help you spot profitable product categories, and help identify items popular in specific cities. This advanced example uses pivot tables, described in Chapter 20.
Excel’s not just a math wizard; if you want to add a little life to your data, you can inject color, apply exotic fonts, and even create macros (automated sequences of steps activated by the click of a button) to help speed up repetitive formatting or editing chores. And if you’re bleary-eyed from staring at rows and rows of spreadsheet numbers, you can use Excel’s many chart-making tools to build everything from three-dimensional pie charts to more exotic scatter graphs (see Chapter 16 to learn about all of Excel’s chart types). Excel can be as simple or as sophisticated as you want it to be.
Despite the many improvements in software over the years, one feature hasn’t improved a bit: Microsoft’s documentation. In fact, with Office 2003, you get no printed user guide at all. To learn about the thousands of features included in this software collection, Microsoft expects you to read the online help.
Occasionally, these screens are actually helpful, like when you’re looking for a quick description explaining a mysterious new function. On the other hand, if you’re trying to learn how to, say, create an attractive chart, you’ll find nothing better than terse and occasionally cryptic instructions.
The purpose of this book, then, is to serve as the manual that should have accompanied Excel 2003 and Excel 2002. In these pages, you’ll find step-by-step instructions and tips for using almost every Excel feature, including those you may not even be aware of.
This book is divided into eight parts, each containing several chapters.
Part 1, Worksheet Basics. In this part, you’ll get acquainted with Excel’s interface and learn the basic techniques for creating spreadsheets and entering and organizing data. You’ll also learn how to format your work to make it more presentable and how to create slick printouts.
Part 2, Formulas and Functions. This part introduces you to Excel’s most important feature—formulas. You’ll learn how to perform calculations ranging from the simple to the complex, and you’ll tackle specialized functions for dealing with all kinds of information, including scientific, statistical, business, and financial data.
Part 3, Organizing Worksheets. The third part covers how to organize and find what’s in your spreadsheet. First, you’ll learn to search, sort, and filter large amounts of information by using data lists. Next, you’ll see how to boil down complex tables with grouping and outlining. Finally, you’ll turn your perfected spreadsheets into reusable templates.
Part 4, Charts and Graphics. The fourth part introduces you to charting and graphics, two of Excel’s most popular features. You’ll learn about the wide range of different chart types available and when each one makes sense to use. You’ll also find out how you can add a little pizzazz to your spreadsheets with pictures.
Part 5, Advanced Data Analysis. In this short part, you’ll tackle some of the more advanced features that people often overlook or misunderstand. You’ll see how to study different possibilities with scenarios, use goal seeking and the Solver add-in to calculate “backward” and fill in missing numbers, and create multi-layered summary reports with pivot tables.
Part 6, Sharing Data with the Rest of the World. The sixth part explores ways that you can integrate Excel with other applications, such as Access and Word. You’ll learn how to extract information from a database and put it in Excel, convert worksheets into Web pages, and collaborate with other people to revise a spreadsheet.
Part 7, Programming Excel. The last part presents a gentle introduction to the world of Excel programming, first with macros and then with the full-featured VBA (Visual Basic for Applications) language, which lets you automate complex tasks.
Part 8, Appendixes. At the end of this book, you’ll find three appendices. The first helps you use Excel’s sometimes useful but often infuriating online help. The second shows you how to customize Excel’s menus and toolbars. And the third gives you a menu-by-menu guide to Excel.
Throughout this book, you’ll find sentences like this one: “Open My Computer→ C:→ Windows folder.” That’s shorthand for a much longer instruction that directs you to open three nested folders in sequence, like this: “On your hard drive, there’s an icon called My Computer. Open that. Inside My Computer, there’s a folder for your C: drive. Open that. Inside your C: drive is your Windows folder. Open that.”
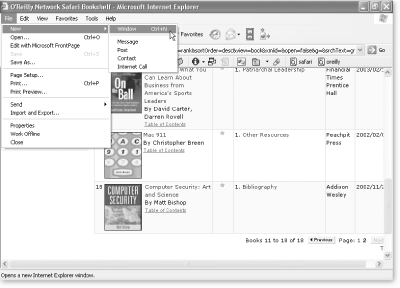
Similarly, this kind of arrow shorthand helps to simplify the business of choosing commands in menus, such as File→ New→ Window, as shown in Figure P-3. You’ll also see this arrow notation used to indicate which tab or pane of a dialog box you’re supposed to click: “Choose Tools→ Options→ General,” for example.
You’ll find very little jargon or nerd terminology in this book. You will, however, encounter a couple of terms that you’ll see frequently in your computing life:
Clicking. This book gives you three kinds of instructions that require you to use your computer’s mouse or trackpad. To click means to point the arrow cursor at something on the screen and then—without moving the cursor at all—press and release the clicker button on the mouse (or laptop trackpad). To double-click, of course, means to click twice in rapid succession, again without moving the cursor at all. And to drag means to move the cursor while pressing the button continuously.
Keyboard shortcuts. Every time you take your hand off the keyboard to move the mouse, you lose time. That’s why many experienced computer fans use keystroke combinations instead of menu commands wherever possible. Ctrl+B, for example, is a keyboard shortcut for boldface type in Excel (and most other programs).
When you see a shortcut like Ctrl+S (which saves changes to the current document), it’s telling you to hold down the Ctrl key, and, while it’s down, type the letter S, and then release both keys.
As you read this book, you’ll see a number of examples that demonstrate Excel features and techniques for building good spreadsheets. Many of these examples are available as Excel workbook files in a separate download. Just surf to http://www.missingmanuals.com, and click the link for this book to visit a page where you can download a zip file that includes the examples, organized by chapter.
At http://www.missingmanuals.com, you’ll find news, articles, and updates to the books in the Missing Manual and Power Hound series.
But the Web site also offers corrections and updates to this book (to see them, click the book’s title, then click Errata). In fact, you’re invited and encouraged to submit such corrections and updates yourself. In an effort to keep the book as up-to- date and accurate as possible, each time we print more copies of this book, we’ll make any confirmed corrections you’ve suggested. We’ll also note such changes on the Web site, so that you can mark important corrections into your own copy of the book.
In the meantime, we’d love to hear your own suggestions for new books in the Missing Manual and Power Hound lines. There’s a place for that on the Web site, too, as well as a place to sign up for free email notification of new titles in the series.

When you see a Safari®-enabled icon on the cover of your favorite technology book that means the book is available online through the O’Reilly Network Safari Bookshelf.
Safari offers a solution that’s better than e-Books. It’s a virtual library that lets you easily search thousands of top tech books, cut and paste code samples, download chapters, and find quick answers when you nee the most accurate, current information. Try it free at http://safari.oreilly.com.
Get Excel 2003: The Missing Manual now with the O’Reilly learning platform.
O’Reilly members experience books, live events, courses curated by job role, and more from O’Reilly and nearly 200 top publishers.

