Name
Chart → Chart Options
Synopsis
The Chart → Chart Options option provides the ability to customize the look of the selected chart. You can indicate items such as the name of the chart, whether gridlines should display, location of the legend, etc. The actual customization options that are available vary depending upon the type of chart selected. When you select this option, the Chart Options dialog displays, as shown in Figure 10-18. The dialog provides several different tabs that can be selected to customize the chart. There are actually six different tabs available on this dialog, but they do not display for all chart types. For example, if you have a Pie chart selected, you will only see the Titles, Legend, and Data Labels tabs.
To customize the chart you need to select each tab and designate the appropriate values for each field. As you make modifications to the chart options, you will be able to see the results in the chart view section that appears on the right side of the dialog.
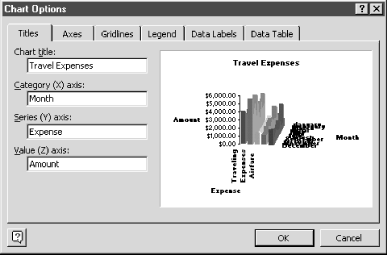
Figure 10-18. Chart Options dialog
Titles Tab
The Titles tab, shown in Figure 10-18, provides the ability to add custom labels to different parts of your chart. The label types available vary based on the chart type selected.
When you create a title Excel places it in a default location on your chart. Remember, you can drag the titles to any location on the chart.
Axes Tab
The Axes tab allows you to specify ...
Get Excel 2000 in a Nutshell now with the O’Reilly learning platform.
O’Reilly members experience books, live events, courses curated by job role, and more from O’Reilly and nearly 200 top publishers.

