Name
KURT
Synopsis
Use KURT to determine the kurtosis for a list of numeric values. The kurtosis of a set of values indicates its “peakedness” in relation to a normal distribution. If the value returned by the function is negative, the numeric value has a flatter distribution. If the returned value is positive, the distribution is fairly peaked.
To Calculate
=KURT(Number1,Number2, ...)
There must be at least one Number argument
specified for this function.
Example
Figure 15-24 illustrates how KURT is used to find the kurtosis for a list of numeric values. You will notice that the example returns a positive value indicating that the distribution of the numeric values is fairly peaked.
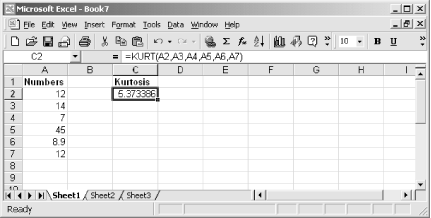
Figure 15-24. Use KURT to determine the kurtosis of a list of numeric values
Get Excel 2000 in a Nutshell now with the O’Reilly learning platform.
O’Reilly members experience books, live events, courses curated by job role, and more from O’Reilly and nearly 200 top publishers.

