5.11. Validating the electrothermal model
To validate the electrothermal model, many trials are done on the 13-fold and 16-fold composites. The trials consist of visualizing the temperature map on the face of the composite opposite the inductor. This visualization is done using an IR camera. The modeled and measured temperature’s evolutions in a point at the surface opposite the inductor at the plate’s center are compared. These trials are done on different stratified types to ensure that the weave plan’s influence on the composite heating is well taken into account.
5.11.1. 13-fold composite
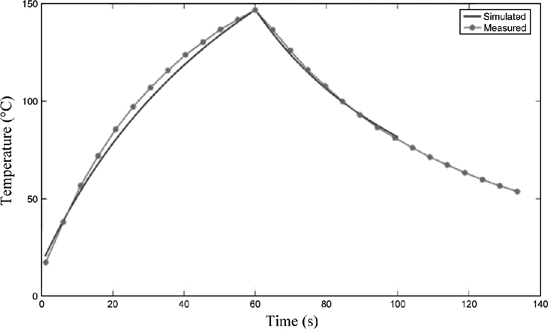
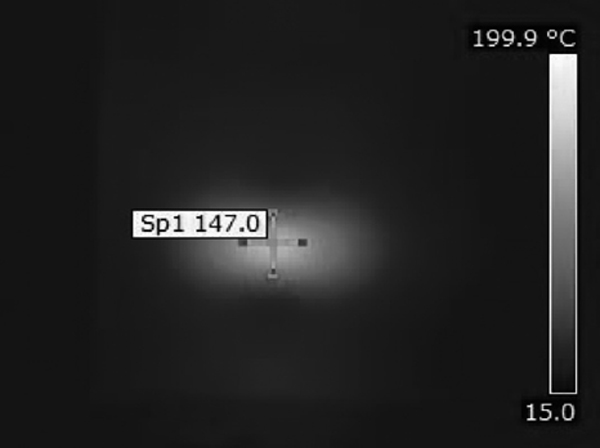
The inductor used for this trial is U-shaped and has dimensions 74 mm × 26 mm × 10 mm. The effective current in the inductor is 72 A at a frequency of 277 kHz. Figure 5.79 compares the simulated and measured temperatures’ evolution at a point at the center of the surface of the plate opposite the inductor. The same goes for the simulated and measured temperature maps, as shown in Figures 5.80 and 5.81.
Figure 5.79. Evolution of temperature at the center of the inductor, opposite side

Figure 5.80. Map of the temperatures measured on the side opposite the inductor: 13-fold composite

Figure 5.81. Map of the simulated temperatures of the side opposite the inductor: 13-fold composite
Figure ...
Get Electrothermics now with the O’Reilly learning platform.
O’Reilly members experience books, live events, courses curated by job role, and more from O’Reilly and nearly 200 top publishers.

