5.4. Setting a Breakpoint
Problem
You need to watch your code while it’s executing to pinpoint a problem.
Solution
Set a breakpoint and start a debug session, which executes your code until the breakpoint is encountered. When execution halts, you can see what’s going on as your code executes.
Discussion
Breakpoints give you the chance to stop your code and take a look around as your program runs. To set a breakpoint in the JDT editor, double-click the marker bar next to the line of executable code to which you want to add a breakpoint (alternatively, highlight the line and select Run→ Add/Remove Breakpoint to toggle breakpoints). To remove the breakpoint later, just double-click it again.
To see how this works, we’ll set a breakpoint in the code we’ve been developing:
public class DebugClass
{
    public static void main(String[] args)
    {
        for(int loopIndex = 3; loopIndex > 0; loopIndex--)
        {
            System.out.println(loopIndex + "...");
            if(loopIndex == 0)
            {
                System.out.println("Houston, we have liftoff.");
            }
        }
    }
}
The breakpoint icon (in the shape of a small circle) appears to the left of this line in the JDT editor, as shown in Figure 5-9.
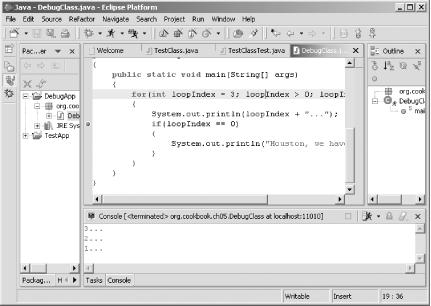
Figure 5-9. A new breakpoint
Now select Run→ Debug As→ Java Application, and you’ll see your application stopped at the breakpoint, as shown in Figure 5-10.
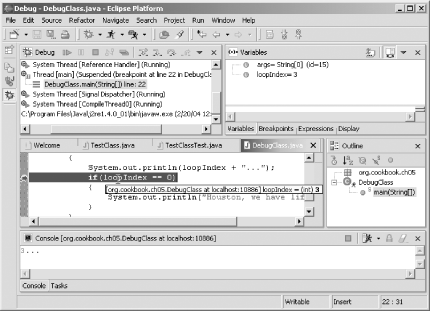
Figure 5-10. Halting ...
Get Eclipse Cookbook now with the O’Reilly learning platform.
O’Reilly members experience books, live events, courses curated by job role, and more from O’Reilly and nearly 200 top publishers.

