CHAPTER 8MEANS AND MEAN REVERSION
Once you have a good base number set—whether that set is a simple dollar price or some sort of a ratio—one way to put the data into long-term perspective is with a mean, or arithmetical average.
The mean is simply the average of the data for a certain period of time. Figure 8-1 shows price to prior peak earnings from 1870 to September 2011, with the simplest mean line imaginable. Half the data points are above the line, and half below it.
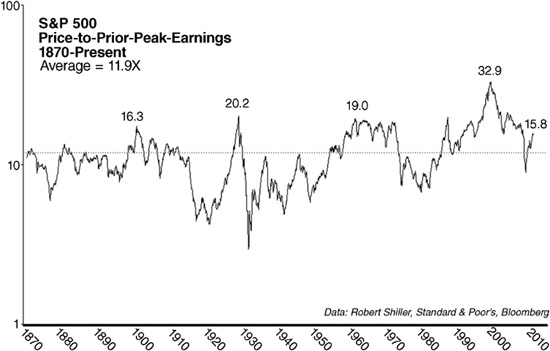
Figure 8-1: Standard & Poor’s 500 Index (S&P 500) Price to Prior Peak Earnings With Mean Line, 1870–Present.
With the exception of a short blip in 2008, we have been above ...
Get Deemer on Technical Analysis: Expert Insights on Timing the Market and Profiting in the Long Run now with the O’Reilly learning platform.
O’Reilly members experience books, live events, courses curated by job role, and more from O’Reilly and nearly 200 top publishers.

