Chapter 6. The Chord Diagram
A chord diagram, also known as a radial network diagram, is a circular diagram with arcs (chords) that connect related points around a circle to show relationships among a group of entities. A chord diagram can be very visually appealing. It is one of my favorite data visualizations. I am very excited to walk through the creation of one with you. You can see an example of a chord diagram in Figure 6.1.
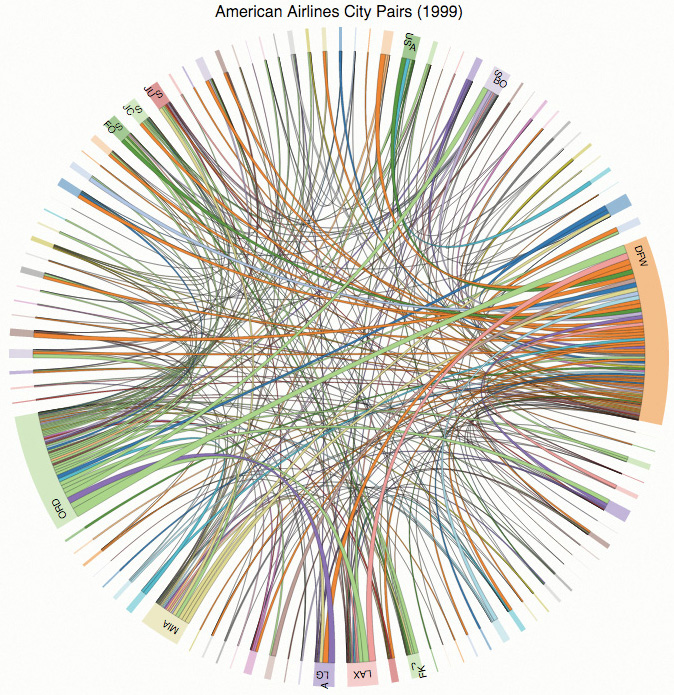
Figure 6.1 Example chord diagram.
The Matrix Is the Truth
In order to define the relations between all the points, the chord diagram requires the input data be in a special format called a square matrix. An example ...
Get Data Visualization Toolkit: Using JavaScript, Rails™, and Postgres to Present Data and Geospatial Information now with the O’Reilly learning platform.
O’Reilly members experience books, live events, courses curated by job role, and more from O’Reilly and nearly 200 top publishers.

