Chapter 1. The Age of the Data Product
We are living through an information revolution. Like any economic revolution, it has had a transformative effect on society, academia, and business. The present revolution, driven as it is by networked communication systems and the Internet, is unique in that it has created a surplus of a valuable new material—data—and transformed us all into both consumers and producers. The sheer amount of data being generated is tremendous. Data increasingly affects every aspect of our lives, from the food we eat, to our social interactions, to the way we work and play. In turn, we have developed a reasonable expectation for products and services that are highly personalized and finely tuned to our bodies, our lives, and our businesses, creating a market for a new information technology—the data product.
The rapid and agile combination of surplus datasets with machine learning algorithms has changed the way that people interact with everyday things and one another because they so often lead to immediate and novel results. Indeed, the buzzword trends surrounding “big data” are related to the seemingly inexhaustible innovation that is available due to the large number of models and data sources.
Data products are created with data science workflows, specifically through the application of models, usually predictive or inferential, to a domain-specific dataset. While the potential for innovation is great, the scientific or experimental mindset that is required to discover data sources and correctly model or mine patterns is not typically taught to programmers or analysts. Indeed, it is for this reason that it’s cool to hire PhDs again—they have the required analytical and experimental training that, when coupled with programming foo, leads almost immediately to data science expertise. Of course, we can’t all be PhDs. Instead, this book presents a pedagogical model for doing data science at scale with Hadoop, and serves as a foundation for architecting applications that are, or can become, data products.
What Is a Data Product?
The traditional answer to this question is usually “any application that combines data and algorithms.”1 But frankly, if you’re writing software and you’re not combining data with algorithms, then what are you doing? After all, data is the currency of programming! More specifically, we might say that a data product is the combination of data with statistical algorithms that are used for inference or prediction. Many data scientists are also statisticians, and statistical methodologies are central to data science.
Armed with this definition, you could cite Amazon recommendations as an example of a data product. Amazon examines items you’ve purchased, and based on similar purchase behavior of other users, makes recommendations. In this case, order history data is combined with recommendation algorithms to make predictions about what you might purchase in the future. You might also cite Facebook’s “People You May Know” feature because this product “shows you people based on mutual friends, work and education information … [and] many other factors”—essentially using the combination of social network data with graph algorithms to infer members of communities.
These examples are certainly revolutionary in their own domains of retail and social networking, but they don’t necessarily seem different from other web applications. Indeed, defining data products as simply the combination of data with statistical algorithms seems to limit data products to single software instances (e.g., a web application), which hardly seems a revolutionary economic force. Although we might point to Google or others as large-scale economic forces, the combination of a web crawler gathering a massive HTML corpus with the PageRank algorithm alone does not create a data economy. We know what an important role search plays in economic activity, so something must be missing from this first definition.
Mike Loukides argues that a data product is not simply another name for a “data-driven app.” Although blogs, ecommerce platforms, and most web and mobile apps rely on a database and data services such as RESTful APIs, they are merely using data. That alone does not make a data product. Instead, he defines a data product as follows:2
A data application acquires its value from the data itself, and creates more data as a result. It’s not just an application with data; it’s a data product.
This is the revolution. A data product is an economic engine. It derives value from data and then produces more data, more value, in return. The data that it creates may fuel the generating product (we have finally achieved perpetual motion!) or it might lead to the creation of other data products that derive their value from that generated data. This is precisely what has led to the surplus of information and the resulting information revolution. More importantly, it is the generative effect that allows us to achieve better living through data, because more data products mean more data, which means even more data products, and so forth.
Armed with this more specific definition, we can go further to describe data products as systems that learn from data, are self-adapting, and are broadly applicable. Under this definition, the Nest thermostat is a data product. It derives its value from sensor data, adapts how it schedules heating and cooling, and causes new sensor observations to be collected that validate the adaptation. Autonomous vehicles such as those being produced by Stanford’s Autonomous Driving Team also fall into this category. The team’s machine vision and pilot behavior simulation are the result of algorithms, so when the vehicle is in motion, it produces more data in the form of navigation and sensor data that can be used to improve the driving platform. The advent of “quantified self,” initiated by companies like Fitbit, Withings, and many others means that data affects human behavior; the smart grid means that data affects your utilities.
Data products are self-adapting, broadly applicable economic engines that derive their value from data and generate more data by influencing human behavior or by making inferences or predictions upon new data. Data products are not merely web applications and are rapidly becoming an essential component of almost every single domain of economic activity of the modern world. Because they are able to discover individual patterns in human activity, they drive decisions, whose resulting actions and influences are also recorded as new data.
Building Data Products at Scale with Hadoop
An oft-quoted tweet3 by Josh Wills provides us with the following definition:
Data Scientist (n.): Person who is better at statistics than any software engineer and better at software engineering than any statistician.
Certainly this fits in well with the idea that a data product is simply the combination of data with statistical algorithms. Both software engineering and statistical knowledge are essential to data science. However, in an economy that demands products that derive their value from data and generate new data in return, we should say instead that as data scientists, it is our job to build data products.
Harlan Harris provides more detail about the incarnation of data products:4 they are built at the intersection of data, domain knowledge, software engineering, and analytics. Because data products are systems, they require an engineering skill set, usually in software, in order to build them. They are powered by data, so having data is a necessary requirement. Domain knowledge and analytics are the tools used to build the data engine, usually via experimentation, hence the “science” part of data science.
Because of the experimental methodology required, most data scientists will point to this typical analytical workflow: ingestion→wrangling→modeling→reporting and visualization. Yet this so-called data science pipeline is completely human-powered, augmented by the use of scripting languages like R and Python. Human knowledge and analytical skill are required at every step of the pipeline, which is intended to produce unique, non-generalizable results. Although this pipeline is a good starting place as a statistical and analytical framework, it does not meet the requirements of building data products, especially when the data from which value is being derived is too big for humans to deal with on a single laptop. As data becomes bigger, faster, and more variable, tools for automatically deriving insights without human intervention become far more important.
Leveraging Large Datasets
Intuitively, we recognize that more observations, meaning more data, are both a blessing and a curse. Humans have an excellent ability to see large-scale patterns—the metaphorical forests and clearings though the trees. The cognitive process of making sense of data involves high-level overviews of data, zooming into specified levels of detail, and moving back out again. Details in this process are anecdotal because fine granularity hampers our ability to understand—the metaphorical leaves, branches, or individual trees. More data can be both tightly tuned patterns and signals just as much as it can be noise and distractions.
Statistical methodologies give us the means to deal with simultaneously noisy and meaningful data, either by describing the data through aggregations and indices or inferentially by directly modeling the data. These techniques help us understand data at the cost of computational granularity—for example, rare events that might be interesting signals tend to be smoothed out of our models. Statistical techniques that attempt to take into account rare events leverage a computer’s power to track multiple data points simultaneously, but require more computing resources. As such, statistical methods have traditionally taken a sampling approach to much larger datasets, wherein a smaller subset of the data is used as an estimated stand-in for the entire population. The larger the sample, the more likely that rare events are captured and included in the model.
As our ability to collect data has grown, so has the need for wider generalization. The past decade has seen the unprecedented rise of data science, fueled by the seemingly limitless combination of data and machine learning algorithms to produce truly novel results. Smart grids, quantified self, mobile technology, sensors, and connected homes require the application of personalized statistical inference. Scale comes not just from the amount of data, but from the number of facets that exploration requires—a forest view for individual trees.
Hadoop, an open source implementation of two papers written at Google that describe a complete distributed computing system, caused the age of big data. However, distributed computing and distributed database systems are not a new topic. Data warehouse systems as computationally powerful as Hadoop predate those papers in both industry and academia. What makes Hadoop different is partly the economics of data processing and partly the fact that Hadoop is a platform. However, what really makes Hadoop special is its timing—it was released right at the moment when technology needed a solution to do data analytics at scale, not just for population-level statistics, but also for individual generalizability and insight.
Hadoop for Data Products
Hadoop comes from big companies with big data challenges like Google, Facebook, and Yahoo; however, the reason Hadoop is important and the reason that you have picked up this book is because data challenges are no longer experienced only by the tech giants. Commercial and governmental entities from large to small: enterprises to startups, federal agencies to cities, and even individuals. Computing resources are also becoming ubiquitous and cheap—like the days of the PC when garage hackers innovated using available electronics, now small clusters of 10–20 nodes are being put together by startups to innovate in data exploration. Cloud computing resources such as Amazon EC2 and Google Compute Engine mean that data scientists have unprecedented on-demand, instant access to large-scale clusters for relatively little money and no data center management. Hadoop has made big data computing democratic and accessible, as illustrated by the following examples.
In 2011, Lady Gaga released her album Born This Way, an event that was broadcast by approximately 1.3 trillion social media impressions from “likes” to tweets to images and videos. Troy Carter, Lady Gaga’s manager, immediately saw an opportunity to bring fans together, and in a massive data mining effort, managed to aggregate the millions of followers on Twitter and Facebook to a smaller, Lady Gaga–specific social network, LittleMonsters.com. The success of the site led to the foundation of Backplane (now Place), a tool for the generation and management of smaller, community-driven social networks.
More recently, in 2015, the New York City Police Department installed a $1.5 million dollar acoustic sensor network called ShotSpotter. The system is able to detect impulsive sounds that are related to explosions or gunfire, enabling rapid response by emergency responders to incidents in the Bronx. Importantly, this system is also smart enough to predict if there will be subsequent gunfire, and the approximate location of fire. Since 2009, the ShotSpotter system has discovered that over 75% of gunfire isn’t reported to the police.
The quantified self movement has grown in popularity, and companies have been striving to make technological wearables, personal data collection, and even genetic sequencing widely available to consumers. As of 2012, the Affordable Care Act mandates that health plans implement standardized secure and confidential electronic exchange of health records. Connected homes and mobile devices, along with other personal sensors, are generating huge amounts of individual data, which among other things sparks concern about privacy. In 2015, researchers in the United Kingdom created the Hub of All Things (HAT)—a personalized data collection that deals with the question “who owns your data?” and provides a technical solution to the aggregation of personal data.
Large-scale, individual data analytics have traditionally been the realm of social networks like Facebook and Twitter, but thanks to Place, large social networks are now the provenance of individual brands or artists. Cities deal with unique data challenges, but whereas the generalization of a typical city could suffice for many analytics, new data challenges are arising that must be explored on a per-city basis (what is the affect of industry, shipping, or weather on the performance of an acoustic sensor network?). How do technologies provide value to consumers utilizing their personal health records without aggregation to others because of privacy issues? Can we make personal data mining for medical diagnosis secure?
In order to answer these questions on a routine and meaningful (individual) basis, a data product is required. Applications like Place, ShotSpotter, quantified self products, and HAT derive their value from data and generate new data by providing an application platform and decision-making resources for people to act upon. The value they provide is clear, but traditional software development workflows are not up to the challenges of dealing with massive datasets that are generated from trillions of likes and millions of microphones, or the avalanche of personal data that we generate on a daily basis. Big data workflows and Hadoop have made these applications possible and personalized.
The Data Science Pipeline and the Hadoop Ecosystem
The data science pipeline is a pedagogical model for teaching the workflow required for thorough statistical analyses of data, as shown in Figure 1-1. In each phase, an analyst transforms an initial dataset, augmenting or ingesting it from a variety of data sources, wrangling it into a normal form that can be computed upon, either with descriptive or inferential statistical methods, before producing a result via visualization or reporting mechanisms. These analytical procedures are usually designed to answer specific questions, or to investigate the relationship of data to some business practice for validation or decision making.
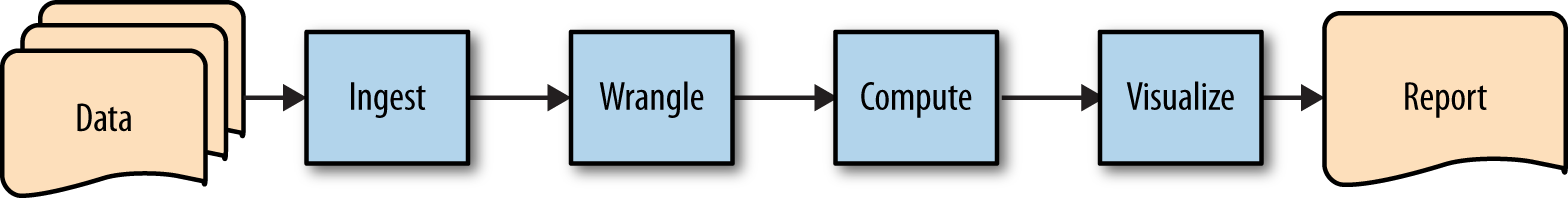
Figure 1-1. The data science pipeline
This original workflow model has driven most early data science thought. Although it may come as a surprise, original discussions about the application of data science revolved around the creation of meaningful information visualization, primarily because this workflow is intended to produce something that allows humans to make decisions. By aggregating, describing, and modeling large datasets, humans are better able to make judgments based on patterns rather than individual data points. Data visualizations are nascent data products—they generate their value from data, then allow humans to take action based on what they learn, creating new data from those actions.
However, this human-powered model is not a scalable solution in the face of exponential growth in the volume and velocity of data that many organizations are now grappling with. It is predicted that by 2020 the data we create and copy annually will reach 44 zettabytes, or 44 trillion gigabytes.5 At even a small fraction of this scale, manual methods of data preparation and mining are simply unable to deliver meaningful insights in a timely manner.
In addition to the limitations of scale, the human-centric and one-way design of this workflow precludes the ability to efficiently design self-adapting systems that are able to learn. Machine learning algorithms have become widely available beyond academia, and fit the definition of data products very well. These types of algorithms derive their value from data as models are fit to existing datasets, then generate new data in return by making predictions about new observations.
To create a framework that allows the construction of scalable, automated solutions to interpret data and generate insights, we must revise the data science pipeline into a framework that incorporates a feedback loop for machine learning methods.
Big Data Workflows
With the goals of scalability and automation in mind, we can refactor the human-driven data science pipeline into an iterative model with four primary phases: ingestion, staging, computation, and workflow management (illustrated in Figure 1-2). Like the data science pipeline, this model in its simplest form takes raw data and converts it into insights. The crucial distinction, however, is that the data product pipeline builds in the step to operationalize and automate the workflow. By converting the ingestion, staging, and computation steps into an automated workflow, this step ultimately produces a reusable data product as the output. The workflow management step also introduces a feedback flow mechanism, where the output from one job execution can be automatically fed in as the data input for the next iteration, and thus provides the necessary self-adapting framework for machine learning applications.
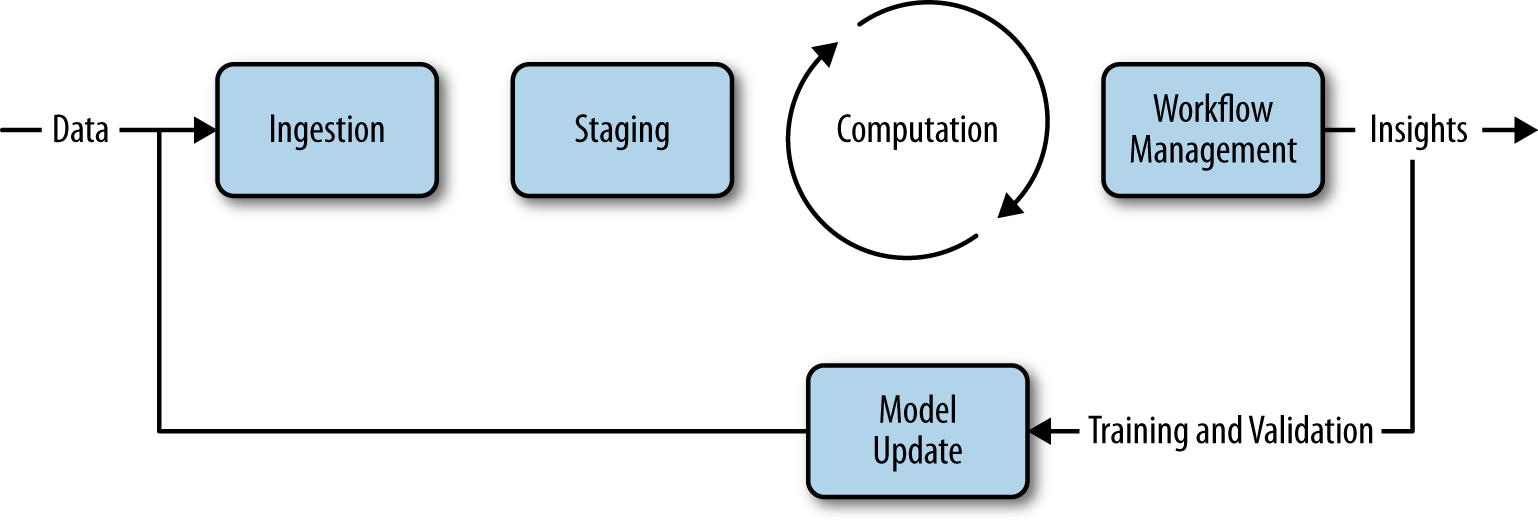
Figure 1-2. The big data pipeline
The ingestion phase is both the initialization of a model as well as an application interaction between users and the model. During initialization, users specify locations for data sources or annotate data (another form of ingestion). During interaction, users consume the predictions of the model and provide feedback that is used to reinforce the model.
The staging phase is where transformations are applied to data to make it consumable and stored so that it can be made available for processing. Staging is responsible for normalization and standardization of data, as well as data management in some computational data store.
The computation phase is the heavy-lifting phase with the primary responsibility of mining the data for insights, performing aggregations or reports, or building machine learning models for recommendations, clustering, or classification.
The workflow management phase performs abstraction, orchestration, and automation tasks that enable the workflow steps to be operationalized for production. The end result of this step should be an application, job, or script that can be run on-demand in an automated fashion.
Hadoop has specifically evolved into an ecosystem of tools that operationalize some part of this pipeline. For example, Sqoop and Kafka are designed for ingestion, allowing the import of relational databases into Hadoop or distributed message queues for on-demand processing. In Hadoop, data warehouses such as Hive and HBase provide data management opportunities at scale. Libraries such as Spark’s GraphX and MLlib or Mahout provide analytical packages for large-scale computation as well as validation. Throughout the book, we’ll explore many different components of the Hadoop ecosystem and see how they fit into the overall big data pipeline.
Conclusion
The conversation regarding what data science is has changed over the course of the past decade, moving from the purely analytical toward more visualization-related methods, and now to the creation of data products. Data products are trained from data, self-adapting, and broadly applicable economic engines that derive their value from data and generate new data in return. Data products have engaged a new information economy revolution that has changed the way that small businesses, technology startups, larger organizations, and government entities view their data.
In this chapter, we’ve described a revision to the original pedagogical model of the data science pipeline, and proposed a data product pipeline. The data product pipeline is iterative, with two phases: the building phase and the operational phase (which is comprised of four stages: interaction, data, storage, and computation). It serves as an architecture for performing large-scale data analyses in a methodical fashion that preserves experimentation and human interaction with data products, but also enables parts of the process to become automated as larger applications are built around them. We hope that this pipeline can be used as a general framework for understanding the data product lifecycle, but also as a stepping stone so that more innovative projects may be explored.
Throughout this book, we explore distributed computing and Hadoop from the perspective of a data scientist—and therefore with the idea that the purpose of Hadoop is to take data from many disparate sources, in a variety of forms, with a large number of instances, events, and classes, and transform it into something of value: a data product.
1 Hillary Mason and Chris Wiggins, “A Taxonomy of Data Science”, Dataists, September 25, 2010.
2 Mike Loukides, “What is Data Science?”, O’Reilly Radar, June 2, 2010.
3 Available at http://bit.ly/data-scientist-tweet.
4 Harlan Harris, “What Is a Data Product?”, Analytics 2014 Blog, March 31, 2014.
5 EMC Digital Universe with Research & Analysis by IDC, “The Digital Universe of Opportunities”, April 2014.
Get Data Analytics with Hadoop now with the O’Reilly learning platform.
O’Reilly members experience books, live events, courses curated by job role, and more from O’Reilly and nearly 200 top publishers.

