The Output Curve
14 Now it's time to look at the output curve in a little more detail. Take a look at the curve shown in Figure 7.19 for an example.
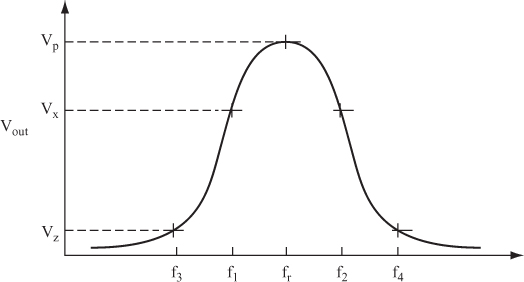
An input signal at the resonant frequency, fr, passes through a circuit with minimum attenuation, and with its output voltage equal to the peak output voltage, Vp, shown on this curve.
The two frequencies f1 and f2 are “passed” almost as well as fr is passed. That is, signals at those frequencies have a high output voltage, almost as high as the output of a signal at fr. The graph shows this voltage as Vx.
Signals at frequencies f3 and f4 have a low output voltage.
These two frequencies are not passed but are said to be blocked or rejected by the circuit. This output voltage is shown on the graph as Vz.
The output or frequency response curve for a resonant circuit (series or parallel) has a symmetrical shape for a high value of Q. You can make the assumption that the output curve is symmetrical when Q is greater than 10.
Get Complete Electronics Self-Teaching Guide with Projects now with the O’Reilly learning platform.
O’Reilly members experience books, live events, courses curated by job role, and more from O’Reilly and nearly 200 top publishers.

