MULTIDIMENSIONAL DISPLAYS
Representing several distinct measures for a collection of points is problematic in both text and graphics. The construction of tables for this display is difficult due to the necessity of effectively communicating the array of subtabular information. The same is true in graphical displays, but the distinction of the various quantities is somewhat easier.
Biplots
In principal component analysis, biplots are used to display the contributions of multiple variables in a two-dimensional display. Fewer than 10 variables should be used if the plot is to be readable [Falissard, 2012].
Common errors include all of the following [Gower et al., 2010]:
- Incomplete captions
- Incomplete legends
- Origin not indicated
- Shape/aspect misleading
Biplot scales should always employ the true aspect ratio. The scales of the biplot shown in Figure 10.17 do not. As a result, distances and angles are distorted, making the results impossible to interpret without extensive discussion. Moreover, the four scales (top, bottom, right, and left) measure two different things:
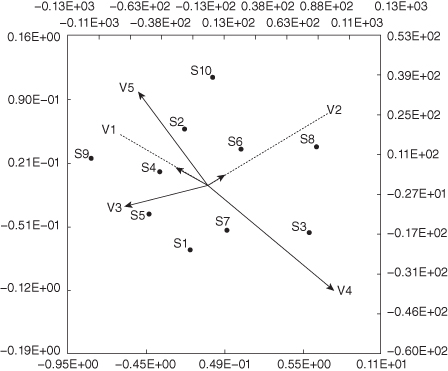
Putting the scales in scientific ...
Get Common Errors in Statistics (and How to Avoid Them), 4th Edition now with the O’Reilly learning platform.
O’Reilly members experience books, live events, courses curated by job role, and more from O’Reilly and nearly 200 top publishers.

