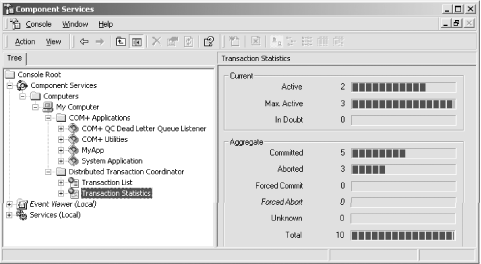
The Component Services Explorer can show you various transactions statistics. You view the statistics by selecting the Transaction Statistics item in the DTC folder (see Figure 4-16). The statistics view contains various numbers regarding the currently executing transactions, as well as aggregated numbers resulting from all transactions that took place since the last machine reboot.
The following list contains explanations of the various statistics:
- Active
The total number of currently executing transactions.
- Max. Active
The maximum number of transactions that were active concurrently since the last reboot. This number can be used as a crude throughput indicator.
- In Doubt
The total number of transactions currently in doubt.
- Committed
The total number of transactions committed since the last reboot.
- Aborted
The total number of transactions aborted since the last reboot.
- Forced Commit
The total number of transaction that were in doubt that the administrator resolved by forcing to commit. A value other then zero is usually the result of a catastrophe that was resolved manually.
- Forced Abort
The total number of transactions that were in doubt that the administrator resolved by forcing to abort. A value other then zero is usually the result of a catastrophe that was resolved manually.
- Unknown
The total number of transactions whose fate is unknown.
- Total
The total number of transactions created since the last reboot.
The statistics are useful when you try to calibrate various application parameters, such as pool sizes, to maximize throughput. An important throughput indicator is the number of transactions processed in a given amount of time. You can get that number and quality metrics, such as the number of aborted transactions, from the statistics view.
Get COM & .NET Component Services now with the O’Reilly learning platform.
O’Reilly members experience books, live events, courses curated by job role, and more from O’Reilly and nearly 200 top publishers.

