Lessons from Rolling Dice
Before we delve into some statistics, we explore what happens when rolling dice, as in the game of craps. What happens in Vegas . . . can form the basis of a deeper understanding of statistical phenomena. Let’s consider how the likelihood of a given total shifts as the number of dice increase.
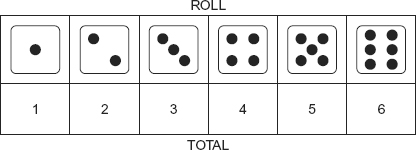
If we roll exactly one six-sided die, the number of permutations, and thus expected relative frequency of outcomes, is equal, as shown in Exhibit 15.1. There is exactly one way to roll a total of 1, which is by rolling a “1.” There is exactly one way to roll a total of 2, which is by rolling a “2,” and so on. The distribution of outcomes is flat: A high result is just as likely as a low one. Each outcome has a theoretical probability of 1/6.
EXHIBIT 15.1 Outcomes from Rolling One Die
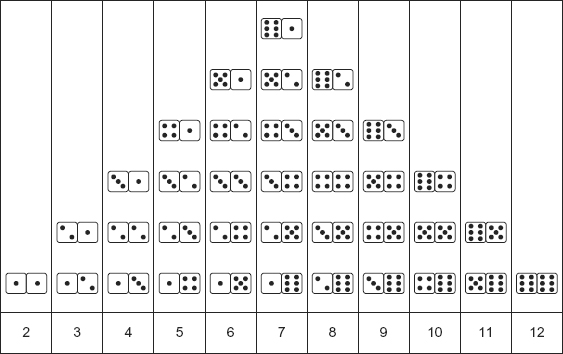
If we play craps and roll two six-sided dice, the relative frequency of outcomes follows a triangular distribution (see Exhibit 15.2). As is well known, 7 is the most likely total, with a 1 in 6 chance of happening (6 ways out of 36 combinations), and snake eyes—2—and boxcars—12—have only a 1 in 36 chance.
EXHIBIT 15.2 Outcomes from Rolling Two Dice
Now it gets interesting. Exhibit 15.3 shows the possible outcomes of rolling three six-sided dice. There is only one way to make a total ...
Get Cloudonomics: The Business Value of Cloud Computing, + Website now with the O’Reilly learning platform.
O’Reilly members experience books, live events, courses curated by job role, and more from O’Reilly and nearly 200 top publishers.

