6. Hypermedia Documents
When you're looking around on the Web, going from site to site, you may have seen virtual documents that greet you, pages with graphics that are created “on the fly,” or sizzling animations. These are all examples of graphic creation and manipulation using CGI. There are numerous tools and utilities that allow you to create documents such as these very quickly and easily.
6.1 Creating Dynamic Home Pages
What is a dynamic (or virtual) home page? It's a document that looks different when viewed at different times or by different people. For example, you may want to display a random fortune cookie when someone visits your home page. If you conduct business on the Web, you might want to use a dynamic document to advertise different products when someone accesses the document.
In order to set up a virtual home page, you have to modify certain configuration settings to ask the server to execute a CGI program instead of displaying a static HTML file. Normally, the NCSA server looks for the file index.html in the document root directory and displays it.
The following line when added to the server resource configuration file (srm.conf) forces the server to execute the CGI program index.html (a Perl program doesn't have to end with a .pl extension):
AddType application/x-httpd-cgi index.html
The AddType server directive was originally introduced in Chapter 1, The Common Gateway Interface. It allows you to execute CGI programs located outside the cgi-bin directory.
Under the CERN server, you can do something similar by adding the following line to httpd.conf:
Exec /index.html /usr/local/etc/httpd/cgi-bin/index.pl
Now, let's create a simple virtual home page that displays a greeting, based on the time of the access, and a message indicating whether the webmaster is currently logged in. Of course, this is a very simple example that illustrates the creation of a home page with dynamic information. You can also create a virtual home page using Server Side Includes, as shown in Chapter 5, Server Side Includes.
#!/usr/local/bin/perl
print "Content-type: text/html", "\n\n";
$webmaster = "shishir";
($seconds, $minutes, $hour) = localtime (time);
The localtime function takes the current time (in seconds since 1970) and returns a nine-element array consisting of the date and time for the current time zone. We will be using only the first three elements of the array, which contain the seconds, minutes, and hour values (in the military 24-hour format).
If your system's time zone is not configured properly, you will get the date and time for the Greenwich time zone (GMT). In such a case, you will need to use the TZ environment variable to set the proper time zone before you call the localtime function:
$ENV{'TZ'} = 'EST';
This sets your time zone to Eastern Standard Time (EST). You can see some of the other time zones by looking at the following document: http://wwwcrasys.anu.edu.au/reference/world.timezones.html
To return to the program:
if ( ($hour >= 23) || ($hour <= 6) ) {
        $greeting = “Wow, you are up late";
} elsif ( ($hour > 6) && ($hour < 12) ) {
        $greeting = "Good Morning";
} elsif ( ($hour >= 12) && ($hour <= 18) ) {
        $greeting = "Good Afternoon";
} else {
        $greeting = "Good Evening";
}
Since the localtime function returns the hour in a 24-hour format, we can use this to our advantage. It is much easier to select a greeting based on this format because the time scale is continuous from 0-23, and we don't have to worry about determining whether an hour value of “12” indicates 12:00 A.M. or 12:00 P.M.
if ($hour > 12) {
        $hour -= 12;
} elsif ($hour == 0) {
        hour = 12;
}
$time = sprintf ("%02d:%02d:%02d", $hour, $minutes, $seconds);
For display purposes, however, the hour is converted into the regular 12-hour format. The sprintf function formats a string according to the field specifiers. In this case, we want the hours, minutes, and seconds to be two digits in length, so a minute value of “9” will be displayed as “09”. The formatted string is stored in the $time variable.
open(CHECK, "/usr/bin/w -h -s $webmaster |");
if (<CHECK> =~ /$webmaster/) {
        $in_out = "I am currently logged in.";
} else {
        $in_out = "I just stepped out.";
}
This open command might look strange to you if you're new to Perl. Instead of opening a file, it opens a pipe for input. In other words, Perl executes the UNIX program /usr/bin/w and redirects its output to the file handle CHECK. As you'll see throughout the book, this technique allows us to communicate with other utilities and programs by sending and receiving data through a pipe.
We pass the value stored in $webmaster as the argument to /usr/bin/w, which returns all of the system processes “owned” by $webmaster. We don't really need to know much about the processes. The only thing we're concerned about is whether any processes for $webmaster exist, indicating that he/she is logged in. Depending on this, the $in_out variable is set to a specific message.
close (CHECK);
Once we're done, we close the file handle. It's a good practice to clean up all resources when you're done with them. Now, we're ready to output the information that we've gathered so far.
Instead of using a print statement to send each line to standard output, we'll use a “here” document. What is that, you may ask? See for yourself:
print <<End_of_Homepage;
This statement outputs everything below it to standard output until it reaches the string “End_of_Homepage.” This saves us from typing print before each line that we want to output.
Since we output a MIME content type of text/html, we need to output some HTML information:
<HTML>
<HEAD><TITLE>Welcome to my home page</TITLE></HEAD>
<BODY>
$greeting! It is $time. Here are some of my favorite links:
.
. (some information)
.
<ADDRESS>
Shishir Gundavaram ($in_out)
</ADDRESS>
</BODY></HTML>
End_of_Homepage
exit(0);
The whole point of this exercise is that you can “embed” another language (like HTML) into a CGI script. But the variables from the enclosing script can be used within the HTML--Perl substitutes the right value for each variable. That's what makes this page dynamic rather than static. An important thing to note about “here” documents is that they follow the same conventions as the regular print statement, in that Perl will evaluate only variables, and not function calls and other expressions.
In this program, we output a MIME content type of text/html and followed that with the HTML code. But we're not limited to just creating dynamic HTML documents; we can create dynamic graphics as well, as we'll see next.
6.2 CGI Examples with PostScript
PostScript is a language for laying out nicely designed pages with all kinds of fonts, pictures, and other things that HTML is not capable of displaying. PostScript on the screen often looks exactly like a page from a book or journal. The language is device independent, so it can be printed or displayed on any device that interprets it. Since most Web browsers don't handle PostScript code, it has to be run through an interpreter to produce an image that browsers can handle. Let's look at some examples that illustrate this concept.
Digital Clock
In this example, we'll write PostScript code to create a virtual image of a digital clock displaying the current time. Since Web browsers can't display PostScript graphics, we will run this code through a PostScript interpreter, GNU GhostScript (freely available for many platforms), to create a GIF image which the browsers can easily handle. You should be conservative when creating dynamic graphics in this manner because GhostScript uses up a lot of system resources. If used wisely, however, these dynamic images can add a lot to your documents.
You can get GhostScript from the following location: http://www.phys.ufl.edu/docs/goodies/unix/previewers/ghostscript.html.
Let's take a step-by-step look at this Perl script, which creates an image of a digital clock where the letters are red (Times Roman 14 point font) and the background is black.
#!/usr/local/bin/perl
$GS = "/usr/local/bin/gs";
$| = 1;
print "Content-type: image/gif", "\n\n";
The first line of code just sets the $GS variable to the path name of the GhostScript executable. You might need to change this to reflect the correct path on your system. Next, the $| variable is set to 1, a Perl convention that makes the standard output unbuffered. Whenever you're outputting any type of graphics, it's better to unbuffer standard output, so Perl flushes the buffer after every print statement. Unfortunately, this degrades performance slightly because the buffer has to be flushed after every write. But it prevents occasional problems where the image data gets lost or corrupted.
And since we're creating a virtual GIF image, we need to output a MIME content type of image/gif.
($seconds, $minutes, $hour) = localtime (time);
if ($hour > 12) {
        $hour -= 12;
        $ampm = "pm";
} else {
        $ampm = "am";
}
if ($hour == 0) {
        $hour = 12;
}
$time = sprintf ("%02d:%02d:%02d %s", $hour, $minutes, $seconds, $ampm);
This code stores the current time as well as an “A.M.” or “P.M.” in the $time variable.
$x = 80;
$y = 15;
We set the image dimensions to 80x15 pixels. Horizontally, 80 pixels are enough to display our time string. And vertically, 15 pixels are sufficient to show a 14-point font.
open (GS, "|$GS -sDEVICE=gif8 -sOutputFile=- -q -g${x}x${y} - 2> /dev/null");
We use open to create a pipe (indicated by the “|” character) for output. This is the opposite of what we did in the previous example. Whatever data is written to the GS file handle is sent directly to GhostScript for execution (or interpretation); there is no need to store information in temporary files.
Several command-line options are used to GhostScript. The most important one is sDEVICE, which specifies the driver that GhostScript will use to create the output. Since we want a GIF image, we'll use the gif8 driver, which is packaged with the default GhostScript installation kit. (Warning: Some system administrators don't install all the default drivers, in which case the following program may not work.)
The -sOutputFile option with a value of “-” indicates that the output image data is to be written to standard output. The -q option turns off any informational messages output by GhostScript to standard output. This is very important because the text messages can corrupt the graphic data, as both are normally written to standard output stream. The -g option sets the dimensions for the output image.
The “-” instructs GhostScript to read PostScript data from standard input, because that's where our script is writing the PostScript code to. Finally, any error messages from GhostScript are discarded by redirecting the standard error to a null device, using the shell syntax 2>/dev/null.
print GS <<End_of_PostScript_Code;
This print statement will write the PostScript code below to the file handle GS until it encounters the “End_of_PostScript_Code” string (another example of a “here” document).
%!PS-Adobe-3.0 EPSF-3.0
%%BoundingBox: 0 0 $x $y
%%EndComments
This is the start of the PostScript code. The first line, starting with %!PS-Adobe-3.0, is very important (it is much like the #! line used at the beginning of Perl scripts). It instructs GhostScript that the input consists of Encapsulated PostScript (EPS) commands. EPS was designed to allow various programs to share and manipulate a single PostScript graphic.
Since EPS was created to share graphic images, the BoundingBox statement in the second line specifies the position and size of the image that will be shared; in this case, the entire image. The EndComments statement ends the header section for the PostScript program.
Before we start examining the main part of our program, let's discuss how PostScript works. PostScript is different from many other programming languages in that it's stack based. What does that mean? If a command needs two arguments, these arguments must be placed “on the stack” before the command is executed. For example, if you want to add two numbers, say 5 and 7, you must place them on the stack first, and then invoke the add operator. The add operator adds the two numbers and places the result back on the stack. Here's the main part of the program:
/Times-Roman findfont 14 scalefont setfont
The operand Times-Roman is first placed on the stack since the findfont operator expects one argument. The scalefont operator also needs one argument (14), and setfont needs two--the font name and the size, which are returned by the findfont and scalefont operators.
/red   {1 0 0 setrgbcolor} def
/black {0 0 0 setrgbcolor} def
We proceed to define the two colors that we'll use in the image: red and black. The setrgbcolor operator needs three operands on the stack: the red, blue, and green indexes (ranging from 0--1) that comprise the color. Red is obtained by setting the red index to the maximum, and leaving the blue and green indices at zero. Black is obtained by setting all three indices to zero.
black clippath fill
0 0 moveto
($time) red show
We use the fill command to fill the clipping region (which represents the entire drawing area) black, in essence creating a black background. The moveto command moves the “cursor” to the origin, which is the lower-left corner in PostScript. The show operator displays the string stored in the Perl variable $time in red.
showpage
Every PostScript program must contain the showpage operator, somewhere near the end. PostScript will not output the image until it sees this operator.
End_of_PostScript_Code
close (GS);
exit(0);
The “End_of_PostScript_Code” string ends the print statement. The GS file handle is closed, and the program exits with a success status (zero).
Figure 6.1 shows how the output of this program will be rendered on a Web browser.
Figure 6.1: PostScript digital clock

Now, how do you go about accessing this program? There are two ways. The first is to open the URL to this CGI program:
http://your.machine/cgi-bin/digital.pl
Or, you can embed this image in another HTML document (either static or dynamic), like so:
<IMG SRC="/cgi-bin/digital.pl">
This second method is very useful as you can include virtual graphics in a static or dynamic HTML document, as you will see in the following section.
Inserting Multiple Dynamic Images
All of the programs we've discussed up to this point returned only one MIME content type. What if you want to create a dynamic HTML document with embedded virtual graphics, animations, and sound. Unfortunately, as of this writing, a CGI program cannot accomplish this task.
The closest we can get to having multiple heterogeneous information in a single document is embedding virtual images in a dynamic HTML document. Here is a simple example:
#!/usr/local/bin/perl
$digital_clock = "/cgi-bin/digital.pl";
print "Content-type: text/html", "\n\n";
print <<End_of_HTML;
.
. (some HTML code)
.
<IMG SRC="$digital_clock">
.
. (some more HTML code)
.
End_of_HTML
exit(0);
When the server executes this CGI program, it returns a dynamic HTML document that consists of the virtual image created by the digital clock program discussed earlier. In other words, the server will execute the digital clock program, and place the output from it into the HTML document.
To reiterate, this technique works only when you are sending a combination of HTML and graphics. If you want to send other data formats concurrently, you'll have to wait until browsers support a special MIME content type that allows you to send more than one data format.
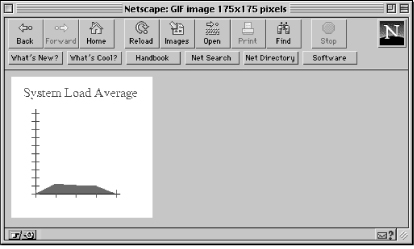
Another Example: System Load Average
The digital clock example presented earlier in the chapter is a very simple example and doesn't use the full power of PostScript. Now, we'll look at an example that uses some of PostScript's powerful drawing operators to create a graph of the system load average:
#!/usr/local/bin/perl
$GS = "/usr/local/bin/gs";
$| = 1;
print "Content-type: image/gif", "\n\n";
$uptime = `/usr/ucb/uptime`;
($load_averages) = ($uptime =~ /average: (.*)$/);
@loads[0..2] = split(/,\s/, $load_averages);
In Perl, the “backtics” (`) allow you to execute a UNIX system command and store its output. In this case, we are storing the output from the uptime command into the variable $uptime. The uptime command returns (among other things) three values representing the load average of the system in the last 5, 10, and 15 minutes (though this may differ among the various UNIX implementations).
I grab the output of uptime, strip it down to the load averages, and place the load averages into an array. Here is the output of a typical uptime command:
12:26AM up 1 day, 17:35, 40 users, load average: 3.55, 3.67, 3.53
A regular expression is used to retrieve data following the word “average:” up until the end of the line. This string, which contains the load averages separated by a comma and a space, is stored in the variable $load_averages. The split operator splits (or separates) the data string on the comma and the space into three values that are stored in the array @loads.
for ($loop=0; $loop <= 2; $loop++) {
        if ($loads[$loop] > 10) {
            $loads[$loop] = 10;
        }
}
This loop iterates through the @loads array and reduces any load average over 10 to exactly 10. This makes it very easy for us to draw the graph. Otherwise, we need to calculate scaling coefficients and scale the graph accordingly.
$x = $y = 175;
open (GS, "|$GS -sDEVICE=gif8 -sOutputFile=- -q -g${x}x${y} - 2> /dev/null");
Through the $x and $y variables, the dimensions of the image are set to 175x175.
print GS <<End_of_PostScript_Code;
%!PS-Adobe-3.0 EPSF-3.0
%%BoundingBox: 0 0 $x $y
%%EndComments
/black  {0 0 0 setrgbcolor} def
/red    {1 0 0 setrgbcolor} def
/blue   {0 0 1 setrgbcolor} def
/origin {0 dup} def
We use the setrgb operator to set the three colors (black, red, and blue) that we need to draw our image. The variable origin contains two zero values; the dup operator duplicates the top item on the stack. Note, the origin in PostScript is defined to be the lower-left corner of the image.
15 150 moveto
/Times-Roman findfont 16 scalefont setfont
(System Load Average) blue show
The moveto operator moves the “cursor” to point (15, 150). We use a blue Times-Roman 16 point for our title. The show operator displays the text.
30 30 translate
translate is a very powerful operator. It moves (or translates, in mathematical terms) the coordinate axes from (0,0) to the point (30, 30). From here on, when we refer to point (0, 0), it will actually be point (30, 30) in the image. I did this translation to make the mathematics of drawing a figure easier.
1 setlinewidth
origin moveto 105 0 rlineto black stroke
origin moveto 0 105 rlineto black stroke
Now we start to draw a figure showing the load average. We set the line width to be one pixel for all drawing operations. The rlineto operator draws two invisible lines from the origin--actually the point (30,30)--to the specified points. These lines are “painted” with the stroke operator. Since we are drawing a graph, these two lines represent the x and y axes in the graph.
Since a normal line extends from one point to the other, two coordinates are required to draw a line. But, in this case, we use the rlineto operator to specify coordinates relative to the current point (the origin).
origin moveto
0 1 10 {
    10 mul 5 neg exch moveto
    10 0 rlineto blue stroke
} for
The loop shown above draws ten tick marks on the y axis. The for loop works the same as in any other language, with one minor exception. The loop variable (or counter) is placed on the top of the stack each time through the loop. In this case, the loop variable is multiplied by 10 on each iteration through the loop and placed on the stack. Then, a value of negative five is also placed on the stack. The two values on the stack (-5 and the counter multiplied by 10) represent the coordinates where a tick has to be drawn, and are swapped with the exch operator. From those coordinates, we draw a blue horizontal line that is 10 pixels in length.
To summarize, here is a step-by-step breakdown of the code we've just discussed:
- Move to the coordinates stored in the origin variable
- Execute the for loop 11 times (from 0 to 10 in increments of 1)
- Move to coordinates (-5, 10 x loop value)
- Draw a blue line from the above coordinates (-5, 10 x loop value) to (5, 10 x loop value) for a length of 10 pixels in the horizontal direction and repeat
- End of loop
Now, let's continue with the program.
origin moveto
0 1 4 {
    25 mul 5 neg moveto
    0 10 rlineto blue stroke
} for
This procedure is nearly the same as the one discussed above, except that we are drawing vertical ticks on the x axis, where each tick mark is separated by 25 pixels (instead of 10), and is 10 pixels in length.
The code below draws five points: the origin, the three load average points, and a point on the x axis itself to “complete” the figure. Then we connect these points to create a filled region that represents the load average over time.
newpath
origin moveto
25 $loads[0] 10 mul lineto
50 $loads[1] 10 mul lineto
75 $loads[2] 10 mul lineto
The newpath operator establishes a new path. A path is used to create closed figures that can then be filled easily with the fill operator. Initially, we use the moveto operator to move to the origin. The load average is scaled by 10 and then used as the y coordinate. The x coordinate is simply incremented in steps of twenty--five-remember, each tick is separated by 25 pixels. Then, we draw a line using these two values. This procedure is repeated for all three load average values.
100 0 lineto
closepath
red fill
showpage
End_of_PostScript_Code
A line is drawn from the last load average coordinate to the point directly on the x axis (100, 0). Finally, to close the figure, we draw a line from (100, 0) to the starting point of the path and fill it with red.
close (GS);
exit(0);
This ends the PostScript section of our script. Back to Perl. The load average graph will look similar to the graph shown in Figure 6.2.
Figure 6.2: Graph of load average
Although it's possible to create graphs in PostScript (as we've just seen), it's much easier and quicker to use other utilities that were developed for the sole purpose of graphing numerical data. Several such utilities along with examples will be discussed later in this chapter.
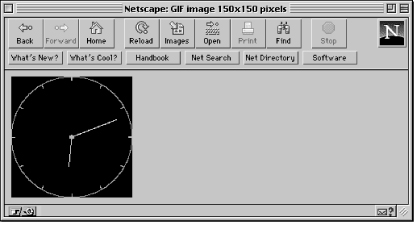
Final PostScript Example: Analog Clock
The final PostScript example we'll look at creates an analog clock using some of the more powerful PostScript operators. The image created by this program looks much like the one produced by the X Window System program xclock.
#!/usr/local/bin/perl
$GS = "/usr/local/bin/gs";
$| = 1;
print "Content-type: image/gif", "\n\n";
($seconds, $minutes, $hour) = localtime (time);
$x = $y = 150;
open (GS, "|$GS -sDEVICE=gif8 -sOutputFile=- -q -g${x}x${y} - 2> /dev/null");
print GS <<End_of_PostScript_Code;
%!PS-Adobe-3.0 EPSF-3.0
%%BoundingBox: 0 0 $x $y
%%EndComments
This initialization code is nearly the same in all of our PostScript examples so far, and should be familiar to you.
/max_length     $x def
/line_size      1.5 def
/marker         5 def
We start out by defining a lot of variables that are based on the values stored in the $x and $y variables. We do this so that if you increase the dimensions of the clock, all the objects of the clock (e.g., the minute and second hands) are scaled correctly. An important thing to note is that the x and y dimensions have to be equal for this automatic scaling to work properly.
The max_length variable sets the maximum length (or height, since this is a square clock) of the frame around the clock. The line width, used to draw the various objects, is stored in the line_size variable. The marker represents the length of the ticks (or markers) that represent the twelve hours on the clock.
/origin         {0 dup} def
/center         {max_length 2 div} def
/radius         center def
/hour_segment    {0.50 radius mul} def
/minute_segment  {0.80 radius mul} def
The origin contains the point (0, 0). Notice that whenever a variable declaration contains PostScript operators, we need to enclose the expression in braces. The center x (or y) coordinate of the clock (75, in this case) is stored in center. The radius of the circle that will encompass the entire drawing area is also 75, and is appropriately stored in the radius variable. The hour_segment contains the length of the line that will represent the hour value, which is half (or 50%) of the radius. The minute_segment contains the length of the minute hand, which is 80% of the radius. These are arbitrary values that make the clock look attractive.
/red            {1 0 0 setrgbcolor} def
/green          {0 1 0 setrgbcolor} def
/blue           {0 0 1 setrgbcolor} def
/black          {0 0 0 setrgbcolor} def
We proceed to define four variables to hold the color values for red, green, blue, and black.
/hour_angle {
    $hour $minutes 60 div add 3 sub 30 mul
    neg
} def
/minute_angle {
        $minutes $seconds 60 div add 15 sub 6 mul
        neg
} def
The angle of the hour and minute hands is calculated by the following formulas:
hour angle = ((minutes / 60) + hour - 3) * 30
minute angle = ((seconds / 60) + minutes - 15) * 6
Try to understand these formulas. The derivation is pretty trivial if you know your trigonometry! Now, let's get to the real drawing routines.
center dup translate
black clippath fill
line_size setlinewidth
origin radius 0 360 arc blue stroke
We use the translate operator to move the origin to the coordinate values stored in the variable center (in this case 75, 75). The fill operator fills the entire drawing area black. The setlinewidth operator sets the default line width for all drawing operations to 1.5 pixels. To finish the outline of the clock, we draw a blue circle. In PostScript terminology, we draw an arc from 0 to 360 degrees with the center at the origin and a radius of 75.
gsave
1 1 12 {
        pop
        radius marker sub 0 moveto marker 0 rlineto red stroke
        30 rotate
} for
grestore
Here is where the code gets a little complicated. We will discuss the gsave and grestore operators in a moment. Let's first look at the for loop, which draws the marks representing the 12 hours. Here is how it does it:
- Execute the for loop 12 times (from 1 to 12 in increments of 1)
- Remove the top value on the stack (or the loop counter) because we have no use for it!
- Move to the coordinate (radius - marker, 0)
- Draw a red line from (radius - marker, 0) to (marker, 0)
- Rotate the x and y axes by 30 degrees and repeat
- End of loop
The most important aspect of this loop is the rotation of the x and y axes, accomplished by the rotate command. This is one of the more powerful features of PostScript! By rotating the axes, all we have to do is draw straight lines, instead of calculating the coordinates for various angles. The gsave and grestore operators keep the rest of the drawing surface intact while the axes are being moved.
origin moveto
hour_segment hour_angle cos mul
hour_segment hour_angle sin mul lineto green stroke
origin moveto
minute_segment minute_angle cos mul
minute_segment minute_angle sin mul
lineto green stroke
origin line_size 2 mul 0 360 arc red fill
showpage
End_of_PostScript_Code
close (GS);
exit(0);
These statements are responsible for drawing the actual minute and second hands, as well as a small circle in the middle of the clock. The mathematical formulas to determine the hour angle are:
hour (x coordinate) = cos (hour angle) * hour segment
hour (y coordinate) = sin (hour angle) * hour segment
The same theory is applied in calculating the angle for the second hand. Figure 6.3 shows how the analog clock will be rendered by a Web browser.
Figure 6.3: PostScript analog clock
As you can see from the PostScript examples that were presented, PostScript contains a lot of very powerful operators for creating and manipulating graphic images. However, you need to do a lot of work (and write complex code) to use PostScript effectively. In the next few sections, we will look at several other tools that will allow us to create dynamic images. These tools can't match the power of PostScript, but are easier to use and master.
6.3 The gd Graphics Library
The gd graphics library, though not as powerful as PostScript, allows us to quickly and easily create dynamic images. One of the major advantages of this library is that it can be used directly from Perl, Tcl, and C; there is no need to invoke another application to interpret and produce graphic images. As a result, the CGI programs we write will not tax the system anywhere near as those in the previous section (which needed to call GhostScript). Other major advantages of the gd library are the functions that allow you to cut and paste from existing images to create new ones.
The gd library was written by Thomas Boutell for the Quest Protein Database Center of Cold Spring Harbor Labs, and has been ported to Tcl by Spencer Thomas, and to Perl version 5.0 by Lincoln Stein and Roberto Cecchini. There are ports of gd for Perl 4.0 as well, but they are not as elegant, because they require us to communicate through pipes. So, we will use Stein's Perl 5.0 port for the examples in this book.
Appendix E, Applications, Modules, Utilities, and Documentation lists URLs from which you can retrieve the gd libraries for various platforms.
Digital Clock
Here is an example of a digital clock, which is identical to the PostScript version in functionality. However, the manner in which it is implemented is totally different. This program loads the gd graphics library, and uses its functions to create the image.
#!/usr/local/bin/perl5
use GD;
$| = 1;
print "Content-type: image/gif", "\n\n";
In Perl 5.0, external modules, such as gd, can be “included” into a program with the use statement. Once the module is included, the program has full access to the functions within it.
($seconds, $minutes, $hour) = localtime (time);
if ($hour > 12) {
        $hour -= 12;
        $ampm = "pm";
} else {
        $ampm = "pm";
}
if ($hour == 0) {
    $hour = 12;
}
$time = sprintf ("%02d:%02d:%02d %s", $hour, $minutes, $seconds, $ampm);
$time_length = length($time);
$font_length = 8;
$font_height = 16;
$x = $font_length * $time_length;
$y = $font_height;
Unlike the analog clock PostScript example, we will actually calculate the size of the image based on the length of the string stored in the variable $time. The reason we didn't elect to do this in the PostScript version is because Times-Roman is not a constant-width font, and so we would have to do numerous calculations to determine the exact dimensions of our dynamic image. But with gd, there are only a few constant-width fonts, so we can calculate the size of the image rather easily.
We use the length function to determine the length (i.e., the number of characters) of the string stored in $time. The image length is calculated by multiplying the font length with the string length. The font we will use is gdLarge, which is an 8x16 constant-width font.
$image = new GD::Image ($x, $y);
Images are “created” by calling the method Image within the GD class, which creates a new instance of the object. For readers not familiar with object-oriented languages, here is what the statement means:
- The new keyword causes space to be allocated for the image.
- The GD is the class, which means what kind of object we're making (it happens to have the same name as the package we loaded with the use statement).
- Within that class is a function (or method) called Image, which takes two arguments.
Note that the whole statement creating an image ends up returning a handle, which we store in $image. Now, following traditional object-oriented practice, we can call functions that are associated with an object method, which operates on the object. You'll see that below.
The dimensions of the image are passed as arguments to the Image method. An important difference between PostScript and gd with regard to drawing is the location of the origin. In gd, the origin is located in the upper-left corner, compared to the lower-left corner for PostScript.
$black = $image->colorAllocate (0, 0, 0);
$red = $image->colorAllocate (255, 0, 0);
The -> part of the function is another object-oriented idea. When you set a color, you naturally have to specify what you're coloring. In object-oriented programming, $image is the object and you tell that object to execute the method. So $image->colorAllocate is Perl 5.0's way of saying, “color the object denoted by $image.” The three arguments that the colorAllocate method expects are the red, blue, and green indices in the range 0--255.
The first color that we allocate automatically becomes the background color. In this case, the image will have a black background.
$image->string (gdLargeFont, 0, 0, $time, $red);
print $image->gif;
exit(0);
The string method displays text at a specific location on the screen with a certain font and color. In our case, the time string is displayed using the red large font at the origin. The most important statement in this entire program is the print statement, which calls the gif method to display the drawing in GIF format to standard output.
You should have noticed some major differences between PostScript and gd. PostScript has to be run through an interpreter to produce GIF output, while gd can be smoothly intermixed with Perl. The origin in PostScript is located in the lower-left corner, while gd's origin is the upper left corner. And most importantly, simple images can be created in gd much more easily than in PostScript; PostScript should be used for creation of complex images only.
System Load Average
The example below graphs the system load average of the system, and is identical to the PostScript version presented earlier in the chapter. As you look at this example, you will notice that gd makes image creation and manipulation very easy.
#!/usr/local/bin/perl5
use GD;
$| = 1;
print "Content-type: image/gif", "\n\n";
$max_length = 175;
$image = new GD::Image ($max_length, $max_length);
$white = $image->colorAllocate (255, 255, 255);
$red = $image->colorAllocate (255, 0, 0);
$blue = $image->colorAllocate (0, 0, 255);
The image is defined to be 175x175 pixels with a white background. We also allocate two other colors, red and blue.
@origin = (30, 140);
This is a two-element array that holds the coordinates for the origin, or lower-left corner, of the graph. Since the natural origin is defined to be the upper-left corner in gd, the point (30, 140) is identical to the (30, 30) origin in the PostScript version. Of course, this is assuming the dimensions of the image are 175x175 pixels.
$image->string (gdLargeFont, 12, 15, “System Load Average", $blue);
$image->line (@origin, 105 + $origin[0], $origin[1], $blue);
$image->line (@origin, $origin[0], $origin[1] - 105, $blue);
We're using the string method to display a blue string “System Load Average” at coordinate (12, 15) using the gdLarge font. We then draw two blue lines, one horizontal and one vertical, from the “origin” whose length is 105 pixels. Notice that a two-element array is passed to the line method, instead of two separate values. The main reason for storing the “origin” in an array is that it is used repeatedly throughout the program. Whenever you use any piece of data multiple times, it is always a good programming technique to store that information in a variable.
for ($y_axis=0; $y_axis <= 100; $y_axis = $y_axis + 10) {
    $image->line (  $origin[0] - 5,
                       $origin[1] - $y_axis,
                       $origin[0] + 5,
                       $origin[1] - $y_axis,
                       $blue  );
}
for ($x_axis=0; $x_axis <= 100; $x_axis = $x_axis + 25) {
    $image->line ( $x_axis + $origin[0],
                   $origin[1] - 5,
                   $x_axis + $origin[0],
                   $origin[1] + 5,
                   $blue );
}
These two for loops draw the tick marks on the y and x axes, respectively. The only difference between these loops and the ones used in the PostScript version of this program is that the origin is used repeatedly when drawing the ticks because gd lacks a function to draw lines relative to the current point (such as rlineto in PostScript).
$uptime = `/usr/ucb/uptime`;
($load_averages) = ($uptime =~ /average: (.*)$/);
@loads[0..2] = split(/,\s/, $load_averages);
for ($loop=0; $loop <= 2; $loop++) {
    if ($loads [$loop]>10) {
        $loads[$loop]=10;
        }
}
We store the system load averages in the @loads array.
$polygon = new GD::Polygon;
An instance of a Polygon object is created to draw a polygon with the vertices representing the three load average values. Drawing a polygon is similar in principle to creating a closed path with several points.
$polygon->addPt (@origin);
for ($loop=1; $loop <= 3; $loop++) {
    $polygon->addPt (    $origin[0] + (25 * $loop),
                     $max_length - ($loads[$loop - 1] * 10)  );
}
$polygon->addPt (100 + $origin[0], $origin[1]);
We use the addPt method to add a point to the polygon. The origin is added as the first point. Then, each load average coordinate is calculated and added to the polygon. To “close” the polygon, we add a final point on the x axis.
$image->filledPolygon ($polygon, $red);
print $image->gif;
exit(0);
The filledPolygon method fills the polygon specified by the $polygon object with solid red. And finally, the entire drawing is printed out to standard output with the gif method.
Analog Clock
Remember how PostScript allows us to rotate the coordinate system? The PostScript version of the analog clock depended on this rotation ability to draw the ticks on the clock. Unfortunately, gd doesn't have functions for performing this type of manipulation. As a result, we use different algorithms in this program to draw the clock.
#!/usr/local/bin/perl5
use GD;
$| = 1;
print "Content-type: image/gif", "\n\n";
$max_length = 150;
$center = $radius = $max_length / 2;
@origin = ($center, $center);
$marker = 5;
$hour_segment = $radius * 0.50;
$minute_segment = $radius * 0.80;
$deg_to_rad = (atan2 (1,1) * 4)/180;
$image = new GD::Image ($max_length, $max_length);
The @origin array contains the coordinates that represent the center of the image. In the PostScript version of this program, we translated (or moved) the origin to be at the center of the image. This is not possible with gd.
$black = $image->colorAllocate (0, 0, 0);
$red = $image->colorAllocate (255, 0, 0);
$green = $image->colorAllocate (0, 255, 0);
$blue = $image->colorAllocate (0, 0, 255);
We create an image with a black background. The image also needs the red, blue, and green colors to draw the various parts of the clock.
($seconds, $minutes, $hour) = localtime (time);
$hour_angle = ($hour + ($minutes / 60) - 3) * 30 * $deg_to_rad;
$minute_angle = ($minutes + ($seconds / 60) - 15) * 6 * $deg_to_rad;
$image->arc (@origin, $max_length, $max_length, 0, 360, $blue);
Using the current time, we calculate the angles for the hour and minute hands of the clock. We use the arc method to draw a blue circle with the center at the “origin” and a diameter of max_length.
for ($loop=0; $loop < 360; $loop = $loop + 30) {
local ($degrees) = $loop * $deg_to_rad;
$image->line ($origin[0] + (($radius - $marker) * cos ($degrees)),
              $origin[1] + (($radius - $marker) * sin ($degrees)),
              $origin[0] + ($radius * cos ($degrees)),
              $origin[1] + ($radius * sin ($degrees)),
              $red);
This loop draws the ticks representing the twelve hours on the clock. Since gd lacks the ability to rotate the axes, we need to calculate the coordinates for these ticks. The basic idea behind the loop is to draw a red line from a point five pixels away from the edge of the circle to the edge.
$image->line ( @origin,
        $origin[0] + ($hour_segment * cos ($hour_angle)),
        $origin[1] + ($hour_segment * sin ($hour_angle)),
                $green  );

$image->line (   @origin,
        $origin[0] + ($minute_segment * cos ($minute_angle)),
        $origin[1] + ($minute_segment * sin ($minute_angle)),
                $green  );
Using the angles that we calculated earlier, we proceed to draw the hour and minute hands with the line method.
$image->arc (@origin, 6, 6, 0, 360, $red);
$image->fill ($origin[0] + 1, $origin[1] + 1, $red);
print $image->gif;
exit(0);
We draw a red circle with a radius of 6 at the center of the image and fill it. Finally, the GIF image is output with the gif method.
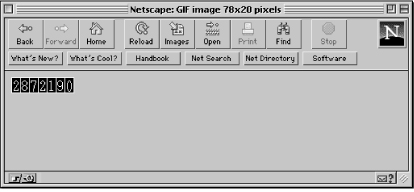
Graphic Counter
Now for something different! In the last chapter, we created a counter to display the number of visitors accessing a document. However, that example lacked file locking, and displayed the counter as text value. Now, let's look at the following CGI program that uses the gd graphics library to create a graphic counter. You can include the graphic counter in your HTML document with the <IMG> tag, as described earlier in this chapter.
What is file locking? Perl offers a function called flock, which stands for “file lock,” and uses the underlying UNIX call of the same name. You simply call flock and pass the name of the file handle like this:
flock (FILE, 2);
This call grants you the exclusive right to use the file. If another process (such as another instance of your own program) is currently locking the file, your program just waits until the file is free. Once you've got the lock, you can safely do anything you want with the file. When you're finished with the file, issue the following call:
flock (FILE, 8);
Other values are possible besides 2 and 8, but these are the only ones you need. Others are useful when you have lots of processes reading a file and you rarely write to it; it's nice to give multiple processes access so long as nobody is writing.
#!/usr/local/bin/perl5
use GD;
$| = 1;
$webmaster = "shishir\@bu\.edu";
$exclusive_lock = 2;
$unlock_lock = 8;
$counter_file =  "/usr/local/bin/httpd_1.4.2/count.txt";
$no_visitors = 1;
You might wonder why a MIME content type is not output at the start of the program, as it was in all of the previous programs. The reason is that file access errors could occur, in which case an error message (in text or HTML) has to be output.
if (! (-e $counter_file)) {
    if (open (COUNTER, ">" . $counter_file)) {
        flock (COUNTER, $exclusive_lock);
        print COUNTER $no_visitors;
        flock (COUNTER, $unlock_lock);
        close (COUNTER);
        } else {
        &return_error (500, "Counter Error", "Cannot create data file to store counter information.");
}
The -e operator checks to see whether the counter file exists. If the file does not exist, the program will try to create one using the “>” character. If the file cannot be created, we call the return_error subroutine (shown in Chapter 4) to return an error message (subroutines are executed by prefixing an “&” to the subroutine name). However, if a file can be created, the flock command locks the counter file exclusively, so that no other processes can access it. The value stored in $no_visitors (in this case, a value of 1) is written to the file. The file is unlocked, and closed. It is always good practice to close files once you're done with them.
} else {
    if (! ((-r $counter_file) && (-w $counter_file)) ) {
        &return_error (500, "Counter Error",
                "Cannot read or write to the counter data file.");
If the program cannot read or write to the file, we call the return_error subroutine with a specific message.
} else {
        open (COUNTER, "<" . $counter_file);
        flock (COUNTER, $exclusive_lock);
        $no_visitors = <COUNTER>;
        flock (COUNTER, $unlock_lock);
        close (COUNTER);
If the file exists, and we can read and write to it, the counter file is opened for input (as specified by the “<” symbol). The file is locked, and a line is read using the <COUNTER>notation. Then, we unlock the file and close it.
$no_visitors++;
        open (COUNTER, ">" . $counter_file);
        flock (COUNTER, $exclusive_lock);
        print COUNTER $no_visitors;
        flock (COUNTER, $unlock_lock);
        close (COUNTER);
    }
}
We increment the counter, open the file for output, and write the new information to the file.
&graphic_counter();
exit(0);
We call the graphic_counter subroutine and exit. This subroutine creates the image and outputs it to standard output.
This is the end of the program. We will now look at the subroutines. Subroutines should be placed at the end of the main program for clarity.
sub graphic_counter
{
    local ( $count_length, $font_length, $font_height, $distance,
    $border, $image_length, $image_height, $image, $black, $blue, $red,
    $loop, $number, $temp_x);
All the variables used exclusively within this subroutine are defined as local variables. These variables are meaningful only within the subroutine; you can't set or retrieve their values in the rest of the program. They are not available once the subroutine has finished executing. It is not mandatory to define local variables, but it is considered good programming practice.
$count_length = length ($no_visitors);
    $font_length = 8;
    $font_height = 16;
We use the length function to determine the length of the string that represents the visitor count. This might be slightly confusing if you are used to working with other programming languages, where you can obtain only the length of a string, and not a numerical value. In this case, Perl converts the number to a string automatically and determines the length of that string. This is one of the more powerful features of Perl; strings and numbers can be intermixed without any harmful consequences. This length and the font length and height are used to calculate the size of the image.
$distance = 3;
    $border = 4;
The $distance variable represents the number of pixels (or distance) from one character to the other in our image, and $border is the sum of the length from the left edge to the first character and from the last character to the right edge. The graphics counter is illustrated in Figure 6.4.
Figure 6.4: Counter with variables marked
Now, let's continue with the rest of the program.
$image_length = ($count_length * $font_length) +
                    (($count_length - 1) * distance) + $border;
    $image_height = $font_height + $border;
    $image = new GD::Image ($image_length, $image_height);
The length and height of the image are determined taking into account the number of characters that represent the counter, the font length, and the distance between characters and the border. We then create a new image with the calculated dimensions:
$black = $image->colorAllocate (0, 0, 0);
    $blue = $image->colorAllocate (0, 0, 255);
    $red = $image->colorAllocate (255, 0, 0);
    $image->rectangle (0, 0, $image_length - 1, $image_height - 1, $blue);
The image consists of a black background with red text and blue lines separating the characters. We also draw a blue rectangle around the entire image. To reiterate, the border variable represents the sum of the number of pixels from this rectangle to the characters on both sides of the image.
for ($loop=0; $loop <= ($count_length - 1); $loop++) {
        $number = substr ($no_visitors, $loop, 1);
This loop iterates through each character of the counter string, prints the character, and draws a line separating each one. Of course, the separating lines will be drawn only if the length of the counter string is more than one--in other words, if the number of visitors is greater than or equal to 10. The substr function returns one character (as specified by the third argument) each time through the loop.
if ($count_length > 1) {

          $temp_x = ($font_length + $distance) * ($loop + 1);

          $image->line (  $temp_x,
                          0,
                          $temp_x,
                          $image_height,
                          $blue  );
      }
We draw a blue line separating each character. The x coordinate corresponding to the line is calculated using the font length, the character position, and the distance between characters. Basically, we leave enough space to hold a character (that's what $font_length is for) plus the space between characters (that's what $distance is for).
$image->char ( gdLargeFont,
             ($border / 2) + ($font_length * $loop) +
                 ($loop * $distance),
             $distance,
             $number,
             $red  );
    }
We use the char method to output each successive character every time through the loop. The x coordinate is calculated using the border, the font length, the character position, and the distance between characters. We could have used the string method to output the character, but since we're dealing with only one character at a time, it is better to use a method created for such a purpose.
print "Content-type: image/gif", "\n\n";
    print $image->gif;
}
Finally, we output the MIME content type, print the GIF graphic data, and exit.
6.4 CGI Examples with gnuplot
gnuplot is a software application suited for graphing simple numerical information. It has the ability to take raw data and create various types of graphs, including point and line graphs and histograms. Let's take a look at an example that illustrates the ease with which we can produce graphs, especially when compared to PostScript and the gd graphics library.
You can get gnuplot from ftp://prep.ai.mit.edu/pub/gnu/gnuplot-3.5.tar.gz.
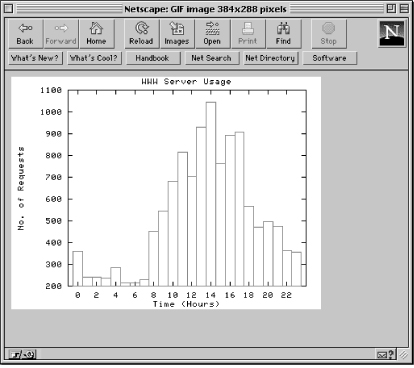
Web Server Accesses
The following example plots the number of Web server accesses for every hour as a histogram. The program parses through the server log file, keeping track of the accesses for each hour of the day in an array. The information stored in this array is written to a file in a format that gnuplot can understand. We then call gnuplot to graph the data in the file and output the resulting graphic to a file.
#!/usr/local/bin/perl
$webmaster = "shishir\@bu\.edu";
$gnuplot  = "/usr/local/bin/gnuplot";
$ppmtogif = "/usr/local/bin/pbmplus/ppmtogif";
$access_log = "/usr/local/bin/httpd_1.4.2/logs/access_log";
The gnuplot utility, as of version v3.5, cannot produce GIF images, but can output PBM (portable bitmap) format files. We'll use the ppmtogif utility to convert the output image from PBM to GIF. The $access_log variable points to the NCSA server log file, which we'll parse.
$process_id = $$;
$output_ppm = join ("", "/tmp/", $process_id, ".ppm");
$datafile = join ("", "/tmp/", $process_id, ".txt");
These variables are used to store the temporary files. The $$ variable refers to the number of the process running this program, as it does in a shell script. I don't care what process is running my program, but I can use the number to create a filename that I know will be unique, even if multiple instances of my program run. (Use of the process number for this purpose is a trick that shell programmers have used for decades.) The process identification is prefixed to each filename.
$x = 0.6;
$y = 0.6;
$color = 1;
The size of the plot is defined to be 60% of the original image in both the x and y directions. All lines in the graph will be red (indicated by a value of 1).
if ( open (FILE, "<" . $access_log) ) {
    for ($loop=0; $loop < 24; $loop++) {
    $time[$loop] = 0;
    }
We open the NCSA server access log for input. The format of each entry in the log is:
host rfc931 authuser [DD/Mon/YY:hh:mm:ss] "request" status_code bytes
where:
- host is either the DNS name or the IP address of the remote client
- rfc931 is the remote user (only if rfc931 authentication is enabled)
- authuser is the remote user (only if NCSA server authentication is enabled)
- DD/Mon/YY is the day, month, and year
- hh:mm:ss is 24-hour-based time
- “request” is the first line of the HTTP request
- status_code is the status identification returned by the server
- bytes is the total number of bytes sent (not including the HTTP header)
A 24-element array called @time is initialized. This array will contain the number of accesses for each hour.
while (<FILE>) {
        if (m|\[\d+/\w+/\d+:([^:]+)|) {
             $time[$1]++;
        }
    }
    close (FILE);
In case you didn't believe me when I said in Chapter 1 that Perl offered superb facilities for CGI programming, this tiny loop contains some proof of what I'm talking about. The regular expression (containing some enhancements that only Perl offers) neatly picks the hour out of the date/time string in the access log by searching for the pattern “[DD/Mon/YY:h:”, as follows:
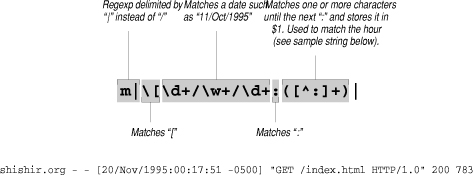
Back to the program. If a line matches the pattern, the array element corresponding to the particular hour is incremented.
&create_output_file();
The subroutine create_output_file is called to create and display the plot.
} else {
    &return_error (500, "Server Log File Error", "Cannot open NCSA server access log!");
}
exit(0);
If the log file can't be opened, the return_error subroutine is called to output an error.
The create_output_file subroutine is now defined. It creates a data file consisting of the information in the @time array.
sub create_output_file
{
    local ($loop);
    if ( (open (FILE, ">" . $datafile)) ) {
        for ($loop=0; $loop < 24; $loop++) {
        print FILE $loop, " ", $time[$loop], "\n";
        }
        close (FILE);

        &send_data_to_gnuplot();
    } else {
        &return_error (500, "Server Log File Error", "Cannot write to data file!");
    }
}
The file specified by the variable $datafile is opened for output. The hour and the number of accesses for that hour are written to the file. The hour represents the x coordinate, while the number of accesses represents the y coordinate. The subroutine send_data_to_gnuplot is called to execute gnuplot.
sub send_data_to_gnuplot
{
    open (GNUPLOT, "|$gnuplot");
    print GNUPLOT <<gnuplot_Commands_Done;
We're going to use the same technique we've used throughout the chapter to embed a “language” within a Perl script: We'll open a pipe to a program and write out commands in the language recognized by the program. The open command starts gnuplot, and the print command sends the data to gnuplot through the pipe.
set term pbm color small
    set output "$output_ppm"
    set size $x, $y
    set title "WWW Server Usage"
    set xlabel "Time (Hours)"
    set ylabel "No. of Requests"
    set xrange [-1:24]
    set xtics 0, 2, 23
    set noxzeroaxis
    set noyzeroaxis
    set border
    set nogrid
    set nokey
    plot "$datafile" w boxes $color
gnuplot_Commands_Done
close (GNUPLOT);
Let's take a closer look at the commands that we send to gnuplot through the pipe. The set term command sets the format for the output file. In this case, the format is a color PBM file with a small font for titles. You can even instruct gnuplot to produce text graphs by setting the term to “dumb.”
The output file is set to the filename stored in the variable $output_ppm. The size of the image is set using the size command. The title of the graph and the labels for the x and y axes are specified with the title, xlabel, and ylabel commands, respectively. The range on the x axis is -1 to 24. Even though we are dealing with data from 0 to 23 hours, the range is increased because gnuplot graphs data near the axes abnormally. The tick marks on the x axis range from 0 to 23 in increments of two. The line representing the y axis is removed by the noyzeroaxis command, which makes the graph appear neater. The same is true for the noxzeroaxis command.
The graph is drawn with a border, but without a grid or a legend. Finally, the plot command graphs the data in the file specified by the $datafile variable with red boxes. Several different types of graphs are possible; instead of boxes, you can try “lines” or “points.”
&print_gif_file_and_cleanup();
}
The print_gif_file_and_cleanup subroutine displays this image, and removes the temporary files.
sub print_gif_file_and_cleanup
{
    $| = 1;
    print "Content-type: image/gif", "\n\n";
    system ("$ppmtogif $output_ppm 2> /dev/null");
    unlink $output_ppm, $datafile;
}
The system command executes the ppmtogif utility to convert the PBM image to GIF. This utility writes the output directly to standard output.
You might wonder what the 2> signifies. Like most utilities, ppmtogif prints some diagnostic information to standard error when transforming the image. The 2> redirects standard error to the null device (/dev/null), basically throwing it away.
Finally, we use the unlink command to remove the temporary files that we've created.
The image produced by this program is shown in Figure 6.5.
6.5 CGI Examples with pgperl
gnuplot is concise and fun for throwing up a few charts, but for sophisticated plotting you may want a more powerful package called pgperl. This is a derivative of Perl that supports the PGPLOT FORTRAN plotting library. Typically it has been used to plot astronomical data, but you can use it to graph any type of data.
You can get pgperl from http://www.ast.cam.ac.uk/~kgb/pgperl.html.
What does pgperl offer that gnuplot doesn't? pgperl contains many powerful plotting functions (all beginning with the prefix “pg”), such as a variety of histograms and mapped contours, which gnuplot doesn't have. Another important consideration is that the pgperl graphic routines are incorporated straight into Perl, and thus there is no need to work with temporary files or pipes. Let's take a look at a pgperl example that graphs the information in the NCSA server log file.
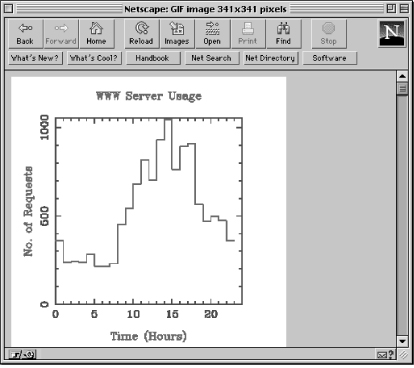
Web Server Accesses
Here is a pgperl program that is similar in functionality to the gnuplot example above. It is intended to show you the differences between gnuplot and pgperl.
#!/usr/local/bin/pgperl
require "pgplot.pl";
$webmaster = "shishir\@bu\.edu";
$access_log = "/usr/local/bin/httpd_1.4.2/logs/access_log";
The require command includes the pgperl header file that consists of various PGPLOT functions.
$hours = 23;
$maximum = 0;
The $maximum variable represents the maximum y coordinate when we plot the histogram. It sets the range on the y axis.
$process_id = $$;
$output_gif = join ("", "/tmp/", $process_id, ".gif");
The output_gif variable is used to store the name of a temporary file that will contain the GIF image.
if ( (open(FILE, "<" . $access_log)) ) {
    for ($loop=0; $loop <= $hours; $loop++) {
           $time[$loop] = 0;
           $counter[$loop] = $loop;
    }
Two arrays are initialized to hold the hour and access data. The @time array holds the number of accesses for each hour, and the @counter array represents the hours (0--23).
while (<FILE>){
        if (m|\[\d+/\w+/\d+:([^:]+)|) {
             $time[$1]++;
        }
}
A regular expression identical to the one presented in the last example is used to determine the number of accesses for each hour.
close (FILE);
    &find_maximum();
    &prepare_graph();
} else {
    &return_error (500, "Server Log File Error", "Cannot open NCSA server access log!");
}
exit(0);
The find_maximum subroutine determines the maximum y value--or the hour that had the most accesses. And the prepare_graph subroutine calls the various pgperl routines to graph the data.
sub find_maximum
{
    for ($loop=0; $loop <= $hours; $loop++) {
        if ($time[$loop] > $maximum) {
        $maximum = $time[$loop];
        }
    }
    $maximum += 10;
}
Initially, the maximum value is set to zero. The number of accesses for each hour is checked against the current maximum value to determine the absolute maximum. Finally, the maximum value is incremented by 10 so the histogram doesn't look cramped. In other words, the range on the y axis will be 10 greater than the maximum value that falls on the axis.
sub prepare_graph
{
    &pgbegin (0, "${output_gif}/VGIF", 1, 1);
    &pgscr (0, 1, 1, 1);
The pgbegin function creates a portrait GIF image with a black background and stores it in the file specified by $output_gif. The first argument is reserved for future use, and is currently ignored. The third and fourth arguments specify the number of graphs that should fit horizontally and vertically, respectively, in the image. Finally, the pgscr function remaps a color index. In this case, we are remapping color zero (black) to one (white). Unfortunately, this is the only way to change the background color.
&pgpap (4.0, 1.0);
pgpap is used to change the width and aspect ratio (width / height) of the image. Normally, the image size is 8.5 x 11 inches in portrait mode. An aspect ratio is the ratio between the x axis and the y axis; 1.0 produces a square image. For example, an aspect ratio of 0.618 results in a horizontal rectangle, and a ratio of 1.618 results in a vertical rectangle. This function changes the width to four inches and the aspect ratio to one.
&pgscf (2);
&pgslw (3);
&pgsch (1.6);
The pgscf function modifies the font style to Roman. Here is a list of all the styles:
Style Attribute
1 Normal
2 Roman
3 Italic
4 Script
The line width and the character height are changed with the pgslw and pgsch functions, respectively.
&pgsci (4);
&pgenv (0, $hours + 1, 0, $maximum, 2, 0);
The pgsci function changes the pen color to blue. We use the pgenv function to draw our axes. The range for the x axis goes from 0 to ($hours + 1), and the range for the y axis is from 0 to the maximum number of accesses plus 10. The fifth argument is responsible for independently scaling the x and y axes. A value of one is used to set equal scales for the x and y axes; any other values cause pgperl to independently scale the axes. The last argument controls the plotting of axes and tick marks. A value of zero instructs pgperl to draw a box around the graph, and to label the coordinates.
&pgsci (2);
    &pgbin ($hours, *counter, *time, 0);
    &pglabel ("Time (Hours)", "No. of Requests", "WWW Server Usage");
    &pgend;
The pen color is again modified to two (red). The crucial routine here is pgbin. It draws a histogram with 23 values (represented by $hours). The x coordinates are specified by the counter array, and the y coordinates--or the number of accesses--are stored in the time array. Notice how the arrays are passed to the pgbin function; they are passed as references--this is a requirement of pgperl. The last argument instructs pgperl to draw the histogram with the edge of each box located at the corresponding x coordinate.
&print_gif();
}
The print_gif subroutine prints the GIF image to standard output.
sub print_gif
{
       local ($content_length);
       if ( (open (GIF, "<" . $output_gif)) ) {
            $content_length = (stat (GIF))[7];
            print "Content-type: image/gif", "\n";
            print "Content-length: ", $content_length, "\n\n";
            print <GIF>;
            close (GIF);
            unlink $output_gif;
          } else {
              &return_error (500, "Server Log File Error",
                               "Cannot read from the GIF file!");
          }
}
Notice that we use the Content-length header in this subroutine. Whenever you are returning binary data (such as GIF images) and it is possible to determine the size of the image, you should make it a habit to send this header. The stat command returns the file size of the graphic image. The file is printed to standard output, and deleted. If you like, you can use the algorithm in Chapter 3 to return the GIF image in small pieces.
Figure 6.6 shows the image created by this script.
6.6 Animation
Although Java is being touted as the best way to do animation on the Web, you can also write CGI programs to produce animation. There are two mechanisms for creating animation: client pull and server push. In client pull, a new HTTP connection is opened every time a document is requested. In server push, however, the connection is kept open until all the data is received by the client. That is the main difference between the two mechanisms. As a result, you can have an animation in an otherwise static document by using the HTML <IMG> tag to access the CGI program instead of a URL to an image, as introduced in the “Inserting Multiple Dynamic Images” section at the beginning of this chapter.
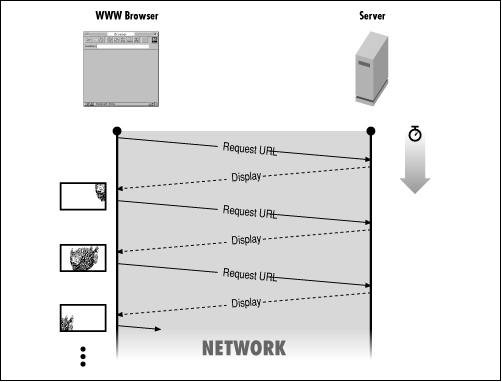
Client pull requires a special directive either in the HTML document header or as a part of the CGI program's HTTP response. This directive instructs the client to retrieve a specified document after a certain amount of time. In other words, the client opens a new connection to the server for each updated image (see Figure 6.7).
Figure 6.7: Animation using client pull
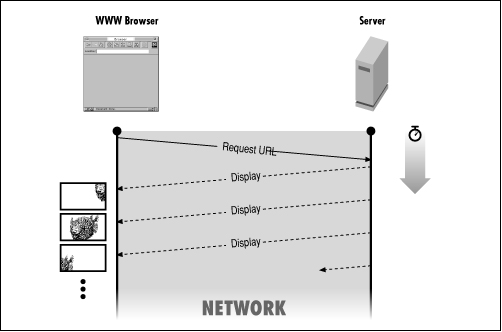
Server push involves sending packets of data to the client periodically, as shown in Figure 6.8. The HTTP connection between the client and the server is kept open indefinitely. Server push can be implemented in a CGI program through the use of the multipart/x-mixed-replace MIME type.
Both client pull and server push are supported only by Netscape Navigator (version 1.1 and higher) and Internet Explorer.
Figure 6.8: Animation using server push
Client Pull
Here is a simple example of an HTML document that displays the time continuously:
<META HTTP-EQUIV="Refresh" CONTENT=5>
<!--#echo var="DATE_LOCAL"-->
Animation depends on updating the browser's window at regular intervals with new material from the server. Browsers provide a way to update their windows called refreshing. In the example shown above, we trick the browser into issuing its refresh command every five seconds, so that it retrieves the document. The document simply uses server side includes to display the current time. (See Chapter 5 for more information on Server Side Includes.)
The META tag is part of the HTML 3.0 specification used to simulate HTTP response headers in HTML documents. In this case, it is used to simulate the “Refresh:” HTTP header with a delay of five seconds.
The “Refresh:” header is non-repeating; it does not load the document repeatedly. However, in this example, “Refresh:” is specified on each retrieval, creating a continuous display.
Here is an example of a CGI program that performs the same operation as the previous HTML code:
#!/usr/local/bin/perl
$delay = 5;
$date = "/bin/date";
print "Refresh: ", $delay, "\n";
print "Content-type: text/plain", "\n\n";
print `$date`;
exit(0);
Remember, SSI directives cannot be included in a CGI program. So, the date command is used to output the current date and time.
Now, let's look at the directive used to load a different document after a specified time:
<META HTTP-EQUIV="Refresh" CONTENT="5; URL=http://your.machine/name.html">
This example loads the file specified by the URL after five seconds. If the file name.html does not contain another “Refresh:” header, there is no animation, because “Refresh:” is non-repeating. The corresponding CGI statement would be:
print "Refresh: 5; URL=http://your.machine/name.html", "\n";
As a final example of client pull, here's a CGI program that loads a document with a random fortune message every ten seconds.
#!/usr/local/bin/perl
$fortune = "/usr/local/bin/fortune";
$refresh_time = 10;
print "Refresh: ", $refresh_time, "\n";
print "Content-type: text/plain", "\n\n";
print "Here is another fortune...", "\n";
print `$fortune`;
exit(0);
This is a repeating document, because a “Refresh:” header is specified every time the program is executed. The program uses the UNIX fortune command, which generates a random fortune each time it is invoked.
Server Push
Server push animations can be created using the multipart/x-mixed-replace MIME type. The “replace” indicates that each data packet replaces the previous data packet. As a result, you can make smooth animations. Here is the format in which this MIME type is used:
Content-type: multipart/x-mixed-replace;boundary=End
--End
Content-type: image/gif
Image #1
--End
Content-type: image/gif
Image #2
--End
Content-type: image/gif
Image #3
--End--
In the first Content-type declaration, we declare the multipart/x-mixed-replace content types and establish “End” as the boundary string. We then repeatedly display new images (declaring new content types of image/gif), ending each image with the “--End” string. The result is that the images are displayed one after another.
Let's look at an example that uses the server push mechanism.
#!/usr/local/bin/perl
$| = 1;
$webmaster = "shishir\@bu\.edu";
$boundary_string = "\n" . "--End" . "\n";
$end_of_data = "\n" . "--End--" . "\n";
$delay_time = 1;
First, we define the boundary strings that need to be sent to the client. We also set the delay time between images-- in this case, one second.
@image_list = ( "image_1.gif",
                 "image_2.gif",
                 "image_3.gif",
                 "image_4.gif",
                 "image_5.gif"  );
All of the images that will be used in the animation are stored in the @image_list array. In this simple example, we use only 5 images.
$browser = $ENV{'HTTP_USER_AGENT'};
if ($browser =~ m#^Mozilla/(1\.[^0]|[2-9])#) {
    print "Content-type: multipart/x-mixed-replace;boundary=End", "\n";
The name of the client browser is obtained using the environment variable HTTP_USER_AGENT. If the browser is Netscape version 1.1 or higher, the multipart MIME type is sent to it, along with the initial boundary string. (Netscape uses “Mozilla” as its user agent string.)
for ($loop=0; $loop < scalar (@image_list); $loop++) {
        &open_and_display_GIF ($image_list[$loop]);
        print $boundary_string;
        sleep ($delay_time);
    }
    print $end_of_data;
A loop is used to iterate through the image_list array. Each image is displayed using the open_and_display_GIF subroutine. A boundary is then sent to the client, and the program proceeds to sleep for the specified amount of time. It is important to print the boundary after the image and before the sleep command to ensure that the server “pushes” the entire image to the client. The process is repeated for all the images in the array. Finally, the terminating boundary string is sent to the client.
} else {
    &open_and_display_GIF ($image_list[0]);
}
exit(0);
If the browser is not Netscape version 1.1 or higher, only the first image stored in the array is displayed.
sub open_and_display_GIF
{
           local ($file) = @_;
           local ($content_length);
           if ( (open (FILE, "<" . $file)) ) {
           $content_length = (stat (FILE))[7];
           print "Content-type: image/gif", "\n";
           print "Content-length: ", $content_length, "\n\n";
           print <FILE>;
           close (FILE);
       } else {
           &return_error (500, "File Access Error",
               "Cannot open graphic file $file!");
       }
}
This routine should be very familiar to you. First, it sends the image/gif MIME type, along with the length of the image. Then, the image is printed to standard output.
One final note: If you are using an NCSA server, it is better to create the CGI server push animation program as a non-parsed header (“nph”) script, as described in Chapter 3, Output from the Common Gateway Interface. That way the server will not parse the HTTP headers, and instead will send the information directly to the client. The main advantage of this is reduced “jerkiness” in the animation. Just to refresh your memory, you need to name the script with an “nph-” prefix, and the first lines that are output from your script should be:
print "HTTP/1.0 200 OK", "\n";
    print "Content-type: multipart/x-mixed-replace;boundary=End", "\n";
Get CGI Programming on the World Wide Web now with the O’Reilly learning platform.
O’Reilly members experience books, live events, courses curated by job role, and more from O’Reilly and nearly 200 top publishers.

