28.5 PERFORMANCE ATTRIBUTION
Exhibit 28.8 illustrates that changes in forward curves, volatilities, time, and interest rates can all impact profits and losses (P&L). A risk manager must be able to attribute the P&L to its components: It is important to know which strategy made money, as well as whether the firm made money by adhering to its strategy or if there was a strategy drift.
EXHIBIT 28.8 Impact of Various Strategies on P&L

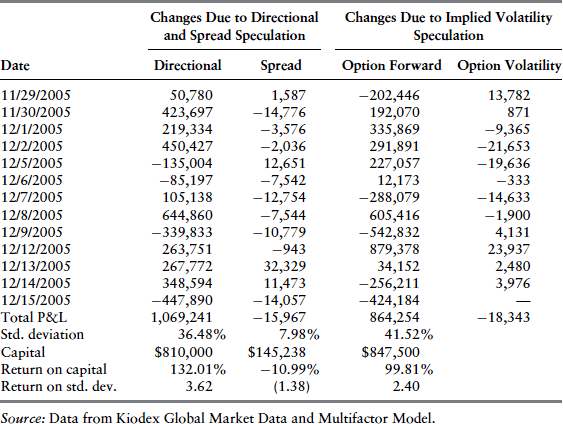
As an example, assume a fund invests in three strategies: directional speculation, speculation on spreads, and speculation on implied volatility. Profits from hypothetical positions in each of the strategies for January 2006 contracts are shown in Exhibit 28.9. For each of the strategies, the change in mark to market (MTM) for different days is calculated. For the volatility strategy, the change in MTM is further broken down between changes in the forward curves and changes in the implied volatilities. The returns are calculated on capital invested (i.e., the margin required) to open these positions on NYMEX.
EXHIBIT 28.9 Forward and Volatility Strategies

A few interesting insights are drawn from Exhibit 28.9. The volatility strategy, which should have demonstrated P&L based on the volatility changes, is, in fact, showing most of its profits due to the ...
Get CAIA Level II: Advanced Core Topics in Alternative Investments, 2nd Edition now with the O’Reilly learning platform.
O’Reilly members experience books, live events, courses curated by job role, and more from O’Reilly and nearly 200 top publishers.

