CONSOLIDATING AND USING THE INPUTS
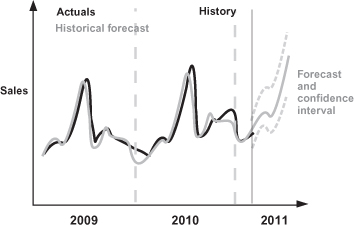
All the patterns in the data can then be combined into a single forecasting model that, from a graphical perspective, could look like Exhibit 7.8. There the actual sales are presented in black and the historical and future forecast is presented in gray. Confidence intervals can also be included; they show what the real sales will be in 95 out of 100 scenarios, given that the market conditions known to the model do not change.
Exhibit 7.8 Graphical Forecast
The sales manager can now enter the number of salespeople and the advertising costs through whatever media and channels that the model has found to be significant, and see the future effect, including setting up targets by month for the year to come. These targets are essentially what we are trying to meet via the campaigns launched over a year. At the same time, based on the confidence interval, critical limits for campaign performance can be defined that will activate the contingency plans needed for the sales department to meet its targets if corrective actions are needed. Also the model can be continuously updated with market data, which in itself will drive a continuous review on the set targets and new campaigning opportunities and essentially will provide your organization with additional market agility.
Forecasting models are an essential tool in industries with limited space capacity ...
Get Business Analytics for Sales and Marketing Managers: How to Compete in the Information Age now with the O’Reilly learning platform.
O’Reilly members experience books, live events, courses curated by job role, and more from O’Reilly and nearly 200 top publishers.

