PRESENTING THE WHALE
The name of the whale model comes from its shape, which resembles a whale with its tail under the water and its body above. In the model the horizontal line does not depict a waterline but a timeline going from the first contact with a customer until the customer-vendor relation ultimately ends. In the middle there is a line that points out the time of the first sale—the point in time from where the sales efforts start to pay. (See Exhibit 2.2.)
Exhibit 2.2 The Whale
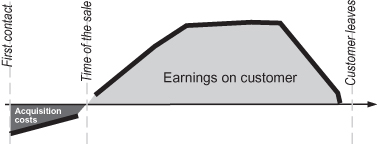
The height of the whale’s profile depicts the earnings of the customer. In the beginning there were no earnings, just acquisition costs; however, because we manage to convert this relationship all the way from a prospect to a customer, this whale has a body depicted above the timeline. We could imagine that there would be a whole lot of tails with no bodies illustrating all the sales attempts that had not been successful, yet that would be wrong since the tail describes the cost of the campaign divided by the number of acquisition. This way we will see that if one campaign generates only one customer, the area of the tail would describe the full campaign costs. Thus, as a rule, good campaigns would have small tails relative to their bodies.
The body of the whale illustrates the customer’s earnings and can be estimated as the average earnings per month multiplied by the number of months you had ...
Get Business Analytics for Sales and Marketing Managers: How to Compete in the Information Age now with the O’Reilly learning platform.
O’Reilly members experience books, live events, courses curated by job role, and more from O’Reilly and nearly 200 top publishers.

