Once you’ve identified your electronic assets, their vulnerabilities, and some attackers, you may wish to correlate and quantify them. In many environments, it isn’t feasible to do so for more than a few carefully selected scenarios. But even a limited risk analysis can be extremely useful in justifying security expenditures to your managers or putting things into perspective for yourself.
One simple way to quantify risk is by calculating Annualized Loss Expectancies (ALE).[4] For each vulnerability associated with each asset, you must do the following:
Estimate the cost of replacing or restoring that asset (its Single Loss Expectancy)
Estimate the vulnerability’s expected Annual Rate of Occurrence
Multiply these to obtain the vulnerability’s Annualized Loss Expectancy
In other words, for each vulnerability, we calculate:
Single Loss       x  expected Annual      = Annualized Loss
Expectency (cost)    Rate of Occurrences    Expectancy (cost/year)
For example, suppose your small business has an SMTP (inbound email) gateway and you wish to calculate the ALE for Denial of Service (DoS) attacks against it. Suppose further that email is a critical application for your business: you and your nine employees use email to bill clients, provide work estimates to prospective customers, and facilitate other critical business communications. However, networking is not your core business, so you depend on a local consulting firm for email-server support.
Past outages, which have averaged one day in length, tend to reduce productivity by about 1/4, which translates to two hours per day per employee. Your fallback mechanism is a facsimile machine, but since you’re located in a small town, this entails long-distance telephone calls and is therefore expensive.
All this probably sounds more complicated than it is; it’s much less imposing when expressed in spreadsheet form (Table 1-1).
Table 1-1. Itemized single-loss expectancy
|
Item description |
Estimated cost |
|---|---|
|
Recovery: consulting time from third-party firm (4 hrs @ $150) |
$600.00 |
|
Lost productivity (2 hours per 10 workers @ avg. $17.50/hr) |
$350.00 |
|
Fax paper, thermal (1 roll @ $16.00) |
$16.00 |
|
Long-distance fax transmissions (20 @ avg. 2 min @ $.25 /min) |
$10.00 |
|
Total SLE for one-day DoS attack against SMTP server |
$976.00 |
To a small business, $976 per incident is a significant sum; perhaps it’s time to contemplate some sort of defense mechanism. However, we’re not done yet.
The next thing to estimate is this type of incident’s Expected Annual Occurrence (EAO). This is expressed as a number or fraction of incidents per year. Continuing our example, suppose your small business hasn’t yet been the target of espionage or other attacks by your competitors, and as far as you can tell, the most likely sources of DoS attacks on your mail server are vandals, hoodlums, deranged people, and other random strangers.
It seems reasonable that such an attack is unlikely to occur more than once every two or three years; let’s say two to be conservative. One incident every two years is an average of 0.5 incidents per year, for an EAO of 0.5. Let’s plug this in to our Annualized Loss Expectancy formula:
950 $/incident * 0.5 incidents/yr = 475 $/yr
The ALE for Denial of Service attacks on the example business’ SMTP gateway is thus $475 per year.
Now, suppose your friends are trying to talk you into replacing your homegrown Linux firewall with a commercial firewall: this product has a built-in SMTP proxy that will help minimize but not eliminate the SMTP gateway’s exposure to DoS attacks. If that commercial product costs $5,000, even if its cost can be spread out over three years (at 10% annual interest, this would total $6,374), such a firewall upgrade would not appear to be justified by this single risk.
Figure 1-1 shows a more complete threat analysis for our hypothetical business’ SMTP gateway, including not only the ALE we just calculated, but also a number of others that address related assets, plus a variety of security goals.
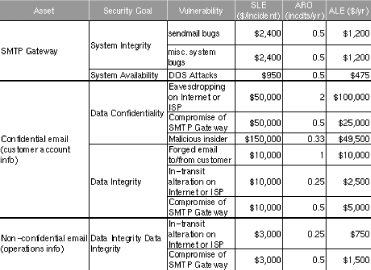
In this sample analysis, customer data in the form of confidential email is the most valuable asset at risk; if this is eavesdropped or tampered with, customers could be lost, resulting in lost revenue. Different perceived loss potentials are reflected in the Single Loss Expectancy figures for different vulnerabilities; similarly, the different estimated Annual Rates of Occurrence reflect the relative likelihood of each vulnerability actually being exploited.
Since the sample analysis in Figure 1-1 is in the form of a spreadsheet, it’s easy to sort the rows arbitrarily. Figure 1-2 shows the same analysis sorted by vulnerability.
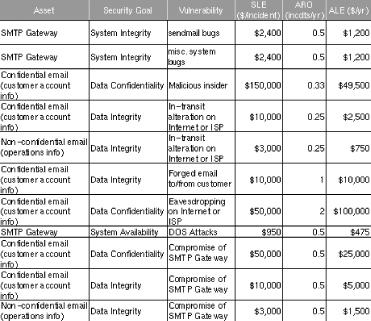
This is useful for adding up ALEs associated with the same vulnerability. For example, there are two ALEs associated with in-transit alteration of email while it traverses the Internet or ISPs, at $2,500 and $750, for a combined ALE of $3,250. If a training consultant will, for $2,400, deliver three half-day seminars for the company’s workers on how to use free GnuPG software to sign and encrypt documents, the trainer’s fee will be justified by this vulnerability alone.
We also see some relationships between ALEs for different vulnerabilities. In Figure 1-2 we see that the bottom three ALEs all involve losses caused by compromising the SMTP gateway. In other words, not only will a SMTP gateway compromise result in lost productivity and expensive recovery time from consultants ($1,200 in either ALE at the top of Figure 1-2); it will expose the business to an additional $31,500 risk of email data compromises for a total ALE of $32,700.
Clearly, the Annualized Loss Expectancy for email eavesdropping or tampering caused by system compromise is high. ABC Corp. would be well advised to call that $2,400 trainer immediately!
There are a few problems with relying on the ALE as an analytical tool. Mainly, these relate to its subjectivity; note how often in the example I used words like “unlikely” and “reasonable.” Any ALE’s significance, therefore, depends much less on empirical data than it does on the experience and knowledge of whoever’s calculating it. Also, this method doesn’t lend itself too well to correlating ALEs with one another (except in short lists like Figures 1-1 and 1-2).
The ALE method’s strengths, though, are its simplicity and flexibility. Anyone sufficiently familiar with their own system architecture, operating costs, and current trends in IS security (e.g., from reading CERT advisories and incident reports now and then) can create lengthy lists of itemized ALEs for their environment with very little effort. If such a list takes the form of a spreadsheet, ongoing tweaking of its various cost and frequency estimates is especially easy.
Even given this method’s inherent subjectivity (which isn’t completely avoidable in practical threat analysis techniques), it’s extremely useful as a tool for enumerating, quantifying, and weighing risks. It’s especially useful for expressing risks in terms that managers can understand. A well-constructed list of Annualized Loss Expectancies can help you not only to focus your IS security expenditures on the threats likeliest to affect you in ways that matter; it can also help you to get and keep the budget you need to pay for those expenditures.
[4] Ozier, Will, Micki Krause and Harold F. Tipton (eds). “Risk Analysis and Management.” Handbook of Information Security Management, CRC Press LLC.
Get Building Secure Servers with Linux now with the O’Reilly learning platform.
O’Reilly members experience books, live events, courses curated by job role, and more from O’Reilly and nearly 200 top publishers.

