18.4 Performance Comparison for Various Estimation Methods
18.4.1 Characteristics of the Trajectories Used for Performance Analysis
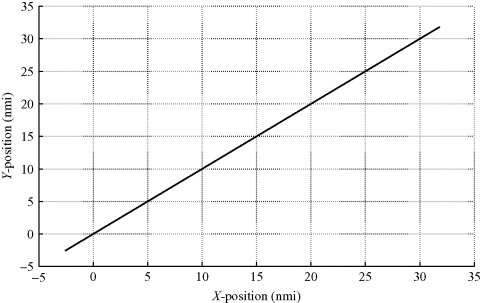
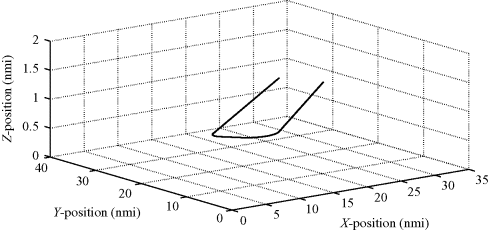
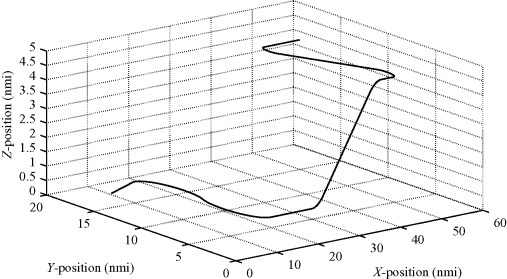
For the purpose of analysis, three target motion scenarios were created using the method outlined in Appendix APPENDIX 18.A. The trajectories associated with each of the three scenarios are shown in Figures 18.1 –18.3.
Figure 18.1 A simulated radially inbound target truth track.

Figure 18.2 A simulated horizontally looping target truth track.

Figure 18.3 A simulated benchmark target truth track.

The first scenario, with the trajectory shown in Figure 18.1, is for a radially moving target that has a constant Cartesian velocity. For this trajectory, the target moves radially inbound at a constant height of 1 nmi (height not shown in Figure 18.1) and passes directly over the radar sensor located at (0, 0, 0). The second scenario, with the trajectory shown in Figure 18.2, consists of a target that executes two turns, with a 90 deg 2 g turn in the first loop and a 90 deg 5 g turn in the second loop. The third trajectory is for a highly maneuvering target that undergoes a 7 g turn followed by a 6 g turn, a deceleration and 5 g dive, a leveling off and an ...
Get Bayesian Estimation and Tracking: A Practical Guide now with the O’Reilly learning platform.
O’Reilly members experience books, live events, courses curated by job role, and more from O’Reilly and nearly 200 top publishers.

