PROBLEMS
4.1. The following autocorrelation sequence is given, ![]() . Describe a source-system mechanism that will generate a signal with this autocorrelation.
. Describe a source-system mechanism that will generate a signal with this autocorrelation.
4.2. Sketch the magnitude frequency response of the following filter function
![]()
4.3. The autocorrelation sequence in Figure 4.11 corresponds to a strongly voiced speech. Show with an arrow which autocorrelation sample relates to the pitch period of the voiced signal. Estimate the pitch period from the graph.
4.4. Consider Figure 4.12 with a white Gaussian input signal.
- Determine analytically the LP coefficients for a first-order predictor and for H(z) = 1/(1 − 0.8z−1).
- Determine analytically the LP coefficients for a second-order predictor and for H(z) = 1 + z−1 + z−2.
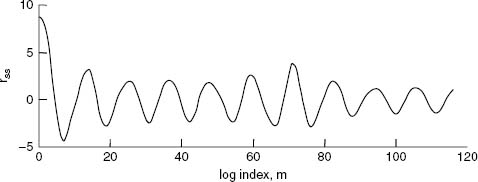
Figure 4.11. Autocorrelation of a voiced speech segment.
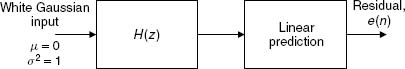
Figure 4.12. LP coefficients estimation.
Get Audio Signal Processing and Coding now with the O’Reilly learning platform.
O’Reilly members experience books, live events, courses curated by job role, and more from O’Reilly and nearly 200 top publishers.

