16.6 Communities in the Framework Program Networks
A popular approach in social network analysis – where networks are often small, consisting of a few dozen nodes – is to visualize the networks and identify community groups by eye. However, the Framework Program networks are much larger: can we “see” the community groups in these networks?
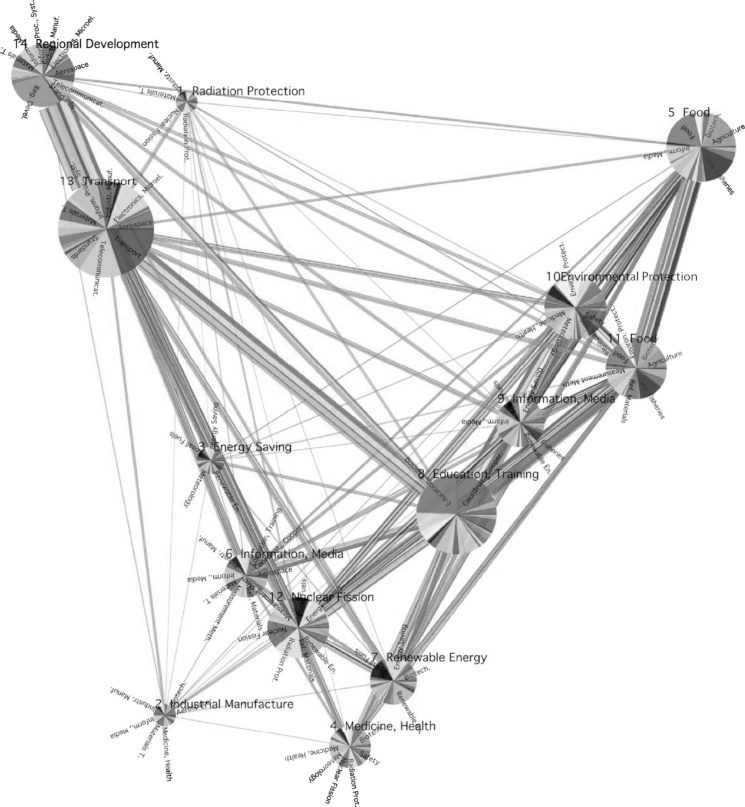
Figure 16.3 Community groups in the network of projects and organizations for FP3.
Structural differences or similarities of such networks are not obvious at a glance. For a graphical representation of the organizations and/or projects by dots on an A4 sheet of paper, we would need to put these dots at a distance of about (1mm) from each other, and even then we still would not have drawn the links (collaborations) that connect them.
Previous studies used a list of coarse graining recipes to compact the networks into a form that would lend itself to a graphical representation [8]. As an alternative we have attempted to detect communities just using BRIM, that is, purely on the basis of relational network structure, ignoring any additional information about the nature of agents.
In Figure 16.3, we show a community structure for FP3 found using the BRIM algorithm, with a modularity of Q = 0.602 for 14 community groups. The communities are shown as vertices in a network, with the vertex positions determined using spectral methods [35]. The area of ...
Get Analysis of Complex Networks now with the O’Reilly learning platform.
O’Reilly members experience books, live events, courses curated by job role, and more from O’Reilly and nearly 200 top publishers.

