CHAPTER 15
Visualizing Value
The best way to learn about maximum value selling is to see what it looks like. Figure 15-1 is a generic sales process. The horizontal x-axis, TIME, measures the duration of the sales process and all the individual sales touches. The vertical y-axis, VALUE, measures the value received by the customer during each step in that process.
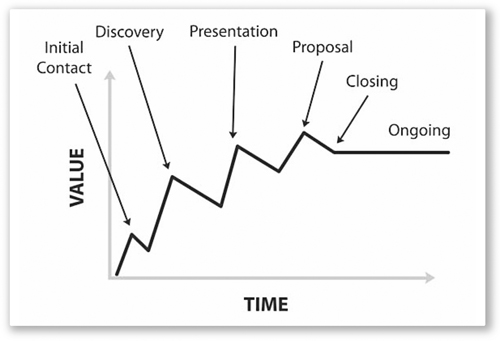
FIGURE 15-1. The Typical Sales Process: Building to the Close
First, note how each little peak in the process signifies a touch, or a customer interaction. It is represented as a peak because the value that you can deliver occurs during a sales interaction. When you are not in front ...
Get Amp Up Your Sales now with the O’Reilly learning platform.
O’Reilly members experience books, live events, courses curated by job role, and more from O’Reilly and nearly 200 top publishers.

