Volume Spikes and Gaps
Finding repetitive patterns on charts is reassuring as it raises confidence in what appears to be occurring. A good example is the combination of two of the most powerful signals: volume spikes and gaps. Figure 8.3 provides an example of an interesting repetitive pattern of consolidation and breakout.
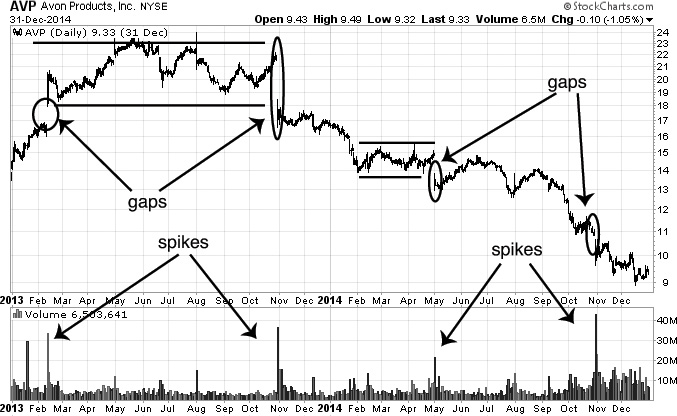
Figure 8.3 Volume spikes and gaps (Chart courtesy of StockCharts.com)
On this chart, the overall volume levels are low (relatively) for most of the period, with distinct volume spikes occurring at the same time as breakout gaps. The first volume and gap combination leads to an upside breakout and then an 11-month consolidation. ...
Get A Technical Approach To Trend Analysis: Practical Trade Timing for Enhanced Profits now with the O’Reilly learning platform.
O’Reilly members experience books, live events, courses curated by job role, and more from O’Reilly and nearly 200 top publishers.

