Rectangle Top and Bottom
The rectangle top and bottom often are found in a trending pattern and can predict either a reversal or a move into consolidation. The chart in Figure 6.6 is typical of this price pattern.
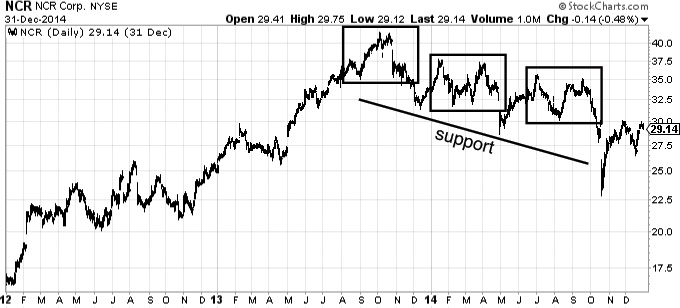
Figure 6.6 Rectangle top and confirmation (Chart courtesy of StockCharts.com)
It appears at first that price is trending downward, but support declines without price breaking through. This can be the start of a new primary bear trend, or just the end of the previous bull trend and a move to consolidation. Continuation is not established, however, until the price spikes below support. The fact that it does not hold reveals that the ...
Get A Technical Approach To Trend Analysis: Practical Trade Timing for Enhanced Profits now with the O’Reilly learning platform.
O’Reilly members experience books, live events, courses curated by job role, and more from O’Reilly and nearly 200 top publishers.

