Rectangle Top and Bottom
A similar pattern is found in the rectangle top and bottom patterns. These are high or low trading ranges marked by ranges of price rather than by specific price points. The rectangle can also be marked by price gaps on both sides or by strong price moves.
An example of a rectangle top is shown in Figure 5.7. Note the similarities in these formations. In the first, the beginning and ending points are marked by gaps; in the second, prices move steeply before and after the rectangle.
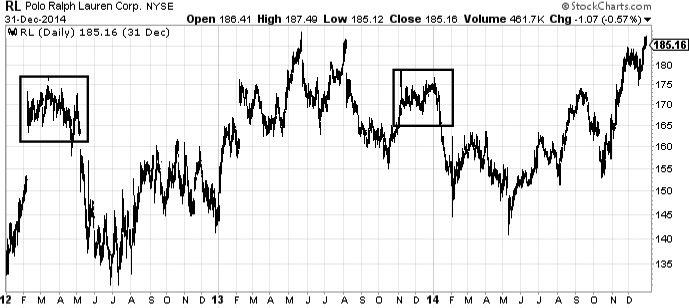
Figure 5.7 Rectangle top (Chart courtesy of StockCharts.com)
The rectangles can be treated as marking resistance on their top, in which ...
Get A Technical Approach To Trend Analysis: Practical Trade Timing for Enhanced Profits now with the O’Reilly learning platform.
O’Reilly members experience books, live events, courses curated by job role, and more from O’Reilly and nearly 200 top publishers.

