Chart controls are some of the most popular commercial controls available. Writing all the graphics code required to create the numerous charts that many business users demand generally isn’t worth your time, but clients may not always want to pay for commercial controls, and, if your requirements are simple, you may not want to fill out the 27 forms it takes to requisition new software at your company. This is where the WebChart control comes in handy.
WebChart is a free chart control that gives you the ability to generate the following types of charts:
Line charts (including smooth)
Column and stacked column charts
Area and stacked area charts
Scattered charts
Pie charts
The WebChart control creates charts by generating the actual images. These images can then be dynamically served up, saved to the filesystem, emailed, and so on as required.
Tool | WebChart |
Version covered | 1.1.0.7 |
Home page | |
Power Tools page | |
Summary | A freely available charting control that, though it might not include all the features of commercial controls, handles creating standard charts in excellent fashion |
License type | Freeware |
Online resources | Samples |
Supported Frameworks | .NET 1.1 (works with 2.0, but compiled in 1.1) |
Related tools in this book | NPlot |

Download the WebChart control from the tool’s home page via the “Click Here to Start Downloading the control” link. The download includes a single assembly that simply needs to be extracted and then referenced in your application (see the Appendix).
You can add the control to your toolbox or just add the required tags:
<%@ Page Language="C#" AutoEventWireup="true" CodeFile="WebChartExample.aspx.cs"
Inherits="WebChartExample" %>
<%@ Register Assembly="WebChart" Namespace="WebChart" TagPrefix="Web" %>
<html xmlns="http://www.w3.org/1999/xhtml" >
<head runat="server">
    <title>Untitled Page</title>
</head>
<body>
    <form id="form1" runat="server">
    <div>
        <Web:ChartControl ID="ChartControl1" runat="server"
                          BorderStyle="Outset" BorderWidth="5px">
        </Web:ChartControl>
    </div>
    </form>
</body>
</html>
To make the chart actually display something, you have to do a little server-side coding. First add a using statement for the WebChart namespace, then create an object corresponding to the type of chart you want to create. There are objects for each of the different chart types. Here’s how to create a line chart:
using System;
using System.Data;
using System.Configuration;
using System.Collections;
using System.Web;
using System.Web.Security;
using System.Web.UI;
using System.Web.UI.WebControls;
using System.Web.UI.WebControls.WebParts;
using System.Web.UI.HtmlControls;
using WebChart;

public partial class WebChartExample : System.Web.UI.Page
{
    protected void Page_Load(object sender, EventArgs e)
    {
        LineChart chart = new LineChart( );
    }
}
Next, add some test data:
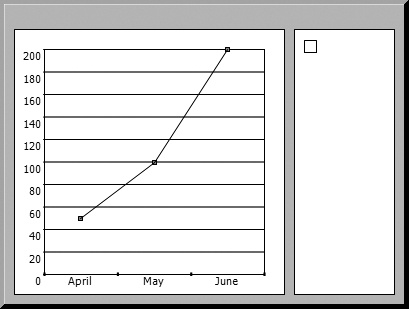
chart.Data.Add(new ChartPoint("April", 50));
chart.Data.Add(new ChartPoint("May", 100));
chart.Data.Add(new ChartPoint("June", 200));
You can manually add the data using the Data object or bind the chart to a dataset. Then add the chart to the WebChart’s Charts collection and draw it:
ChartControl1.Charts.Add(chart);
ChartControl1.RedrawChart( );
When the page is rendered, you will see the chart shown in Figure 1-17.
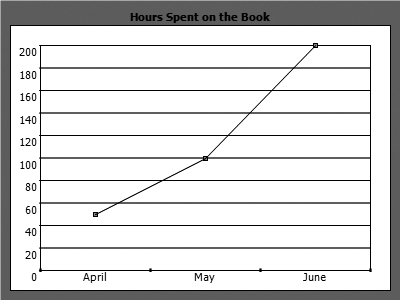
With a couple of tweaks, you can remove the legend, add a title, and adjust the borders and colors a bit:
<Web:ChartControl ID="ChartControl1" runat="server"
                  BorderStyle="None" BorderWidth="5px" HasChartLegend="False">
    <YAxisFont StringFormat="Far,Near,Character,LineLimit" />
    <XTitle StringFormat="Center,Near,Character,LineLimit" />
    <ChartTitle Font="Tahoma, 8pt, style=Bold"
                StringFormat="Center,Near,Character,LineLimit"
                Text="Hours Spent on the Book" />
    <XAxisFont StringFormat="Center,Near,Character,LineLimit" />
    <Background Color="MediumSlateBlue"
                LinearGradientMode="ForwardDiagonal" />
    <YTitle StringFormat="Center,Near,Character,LineLimit" />
</Web:ChartControl>
The resulting chart is shown in Figure 1-18.
Other chart types are generated with the same simple approach: a few lines of code pay you back with a clean, nicely defined graph.
Get Windows Developer Power Tools now with the O’Reilly learning platform.
O’Reilly members experience books, live events, courses curated by job role, and more from O’Reilly and nearly 200 top publishers.

