Log Lines Are Metrics, Too
As we're all aware, some of the best metrics and usage indicators can be found in the logs that applications write. At Flickr, we logged a number of different metrics that could be used to track events over time.
Apache 2.x has support for microsecond resolution for response time in its logs. MySQL can log queries that take over a certain threshold of time, and the Percona build of MySQL allows dynamic tuning of that threshold. Squid will give you the response time and the action of the request (cache MISS, HIT, etc.). Logs contain a treasure trove of information, and treating that information as though it was metrics data is a worthwhile thing to do. Figure 3-2 shows an example of this.
A coworker at Etsy, Mike Brittain, has some great examples of trending metrics found in error logs. When he worked at CafeMom.com, he collected and graphed the types of errors and their rate with Munin, another metrics collection tool (see Figure 3-3). More information and code for how Mike does this is available on his blog, at http://www.mikebrittain.com/blog/2009/12/17/munin-plugins-code-deployment/.
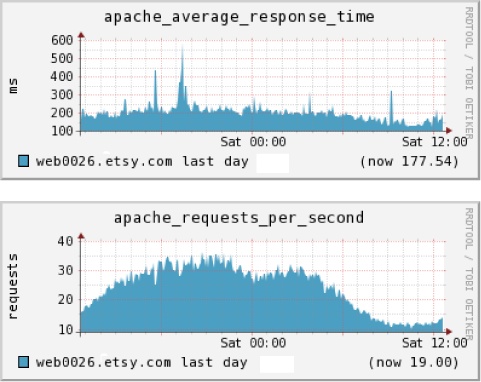
Figure 3-2. Apache metrics taken from log lines
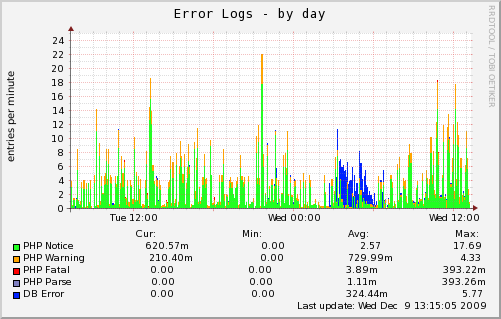
Figure 3-3. Graphing error log entries
Also, an excellent project dedicated to tracking various log formats in Ganglia is available ...
Get Web Operations now with the O’Reilly learning platform.
O’Reilly members experience books, live events, courses curated by job role, and more from O’Reilly and nearly 200 top publishers.

