Normal Distribution
As an example, we’ll start with the normal distribution. As you may remember from statistics classes, the probability density function for the normal distribution is:
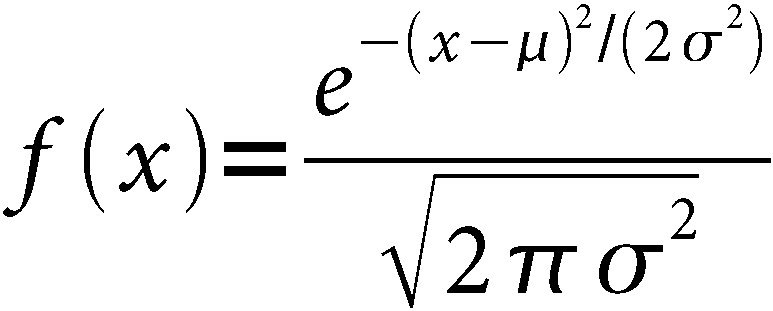
To find the probability density at a given value, use the dnorm function:
dnorm(x, mean = 0, sd = 1, log = FALSE)
The arguments to this function are fairly intuitive: x specifies the value at which to evaluate the
density, mean specifies the mean of the
distribution, sd specifies the standard
deviation, and log specifies whether to
return the raw density (log=FALSE) or
the logarithm of the density (log=TRUE). As an example, you can plot the
normal distribution with the following command:
> plot(dnorm, -3, 3, main = "Normal Distribution")The plot is shown in Figure 17-1.
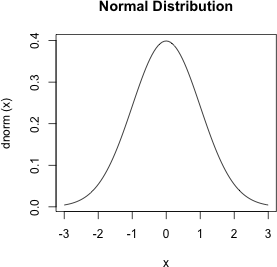
Figure 17-1. Normal distribution
The distribution function for the normal distribution is pnorm:
pnorm(q, mean = 0, sd = 1, lower.tail = TRUE, log.p = FALSE)
You can use the distribution function to tell you the probability
that a randomly selected value from the distribution is less than or equal
to q. Specifically, it returns p
= Pr(x ≤ q). The value
q is specified by the argument q, the mean by mean, and the standard deviation by sd. If you would like the raw value
p, then specify log.p=FALSE; if you would like
log(p), then specify log.p=TRUE ...
Get R in a Nutshell, 2nd Edition now with the O’Reilly learning platform.
O’Reilly members experience books, live events, courses curated by job role, and more from O’Reilly and nearly 200 top publishers.

