Chapter 10. Legends
Like the x- or y-axis, a legend is a guide: it shows people how to map visual (aesthetic) properties back to data values.
Removing the Legend
Problem
You want to remove the legend from a graph.
Solution
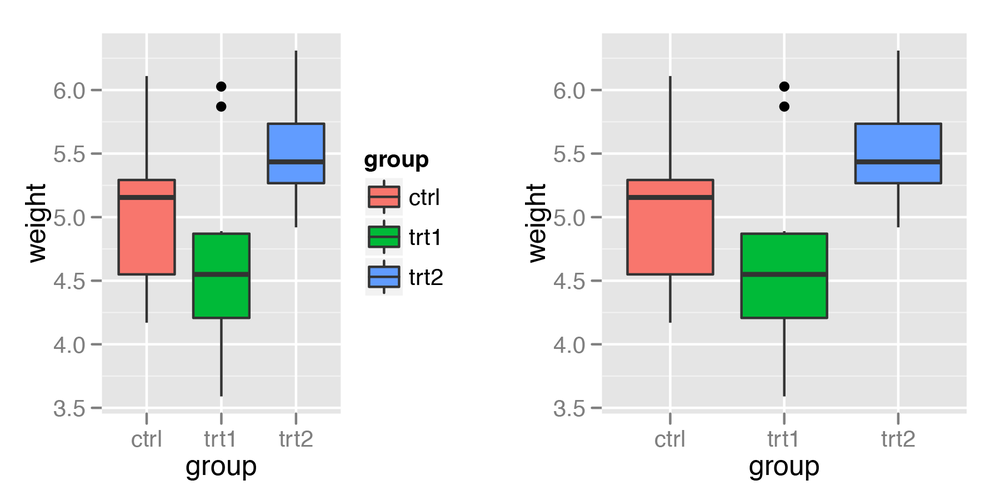
Use guides(), and specify the scale that should have its legend removed
(Figure 10-1):
# The base plot (with legend)p<-ggplot(PlantGrowth,aes(x=group,y=weight,fill=group))+geom_boxplot()p# Remove the legend for fillp+guides(fill=FALSE)
Discussion
Another way to remove a legend is to set guide=FALSE in the scale. This will result in
the exact same output as the preceding code:
# Remove the legend for fillp+scale_fill_discrete(guide=FALSE)
Yet another way to remove the legend is to use the theming
system. If you have more than one aesthetic mapping with a legend
(color and shape, for example), this will remove legends
for all of them:
p+theme(legend.position="none")
Sometimes a legend is redundant, or it is supplied in another graph that will be displayed with the current one. In these cases, it can be useful to remove the legend from a graph.
In the example used here, the colors provide the same information that is on the x-axis, so the legend is unnecessary. Notice that with the legend removed, the area used for graphing the data is larger. If you want to achieve the same proportions in the graphing ...
Get R Graphics Cookbook now with the O’Reilly learning platform.
O’Reilly members experience books, live events, courses curated by job role, and more from O’Reilly and nearly 200 top publishers.

