Tracking a project's activity is very important for end users/stakeholders. Several good indicators are available that can aid in tracking:
The number of commits per day
The number of additional unit tests added every day
The evolution of test percentage coverage
The mailing list activity
The number of existing books on the project (mostly for open source projects)
The number of committers
The number of open issues in the project's bug tracker
The number of years the project has been in existence
It would be very nice to have the equivalent of the Dashboard plug-in, but for project activity. This could provide a global project activity score à la SourceForge project activity percentage (e.g., http://sourceforge.net/project/stats/?group_id=15278).[4] Unfortunately, such a comprehensive plug-in does not yet exist! Instead, you have several ad hoc possibilities:
Use the StatCVS-XML plug-in to analyze a CVS repository and generate statistics.[5] Unfortunately, such a tool doesn't exist for Subversion yet, but it won't be long before one does.
Use the Developer-Activity and File-Activity Maven plug-ins that respectively report on developer commits and files containing the most changes, within a given date range.
Let's discover how to use these plug-ins.
To use the StatCVS-XML plug-in you must install it, as it's not part of the default
Maven distribution. Install the plug-in from http://statcvs-xml.berlios.de/, following the
installation steps described in the Appendix A and in Chapter 6. You'll also need to ensure
you have a command-line CVS client installed, as the plug-in is using
the Ant cvs task to gather CVS logs
for your project.
Using the plug-in cannot be simpler: add the maven-statcvs-plugin report to the reports section of your project's POM and
run maven site. Myriad reports are
generated, but here are a few that you should know more about in order
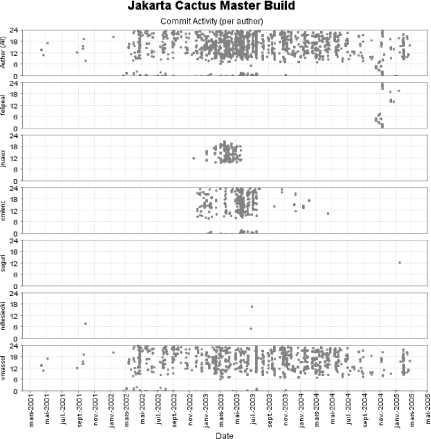
to understand a project's activity. Figure 4-10 shows the commit
activity per author and the aggregated activity over the whole
lifetime of the Jakarta Cactus project.
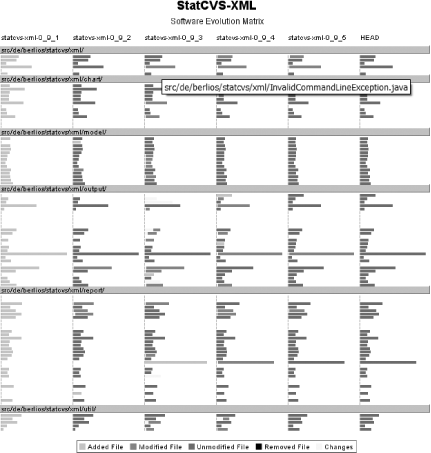
Another very interesting report shows changes brought to a project over time, module by module, as shown in Figure 4-11 for the StatCVS-XML project itself.
The goal here is not to take you through a full-length tutorial of StatCVS-XML, but rather to show you its power and how you can integrate it in a Maven project. You are strongly encouraged to explore it on your own at http://statcvs-xml.berlios.de/.
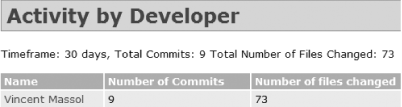
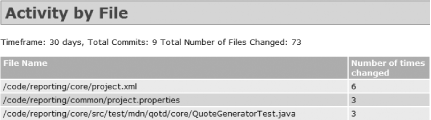
Although StatCVS-XML generates developer and file activity reports, it's still interesting to find out how to use the Developer-Activity and File-Activity plug-ins, as they also support Subversion. To use them, simply add them as usual to your POM. Let's do that on qotd/core/project.xml:
  <reports>
    <report>maven-developer-activity-plugin</report>
    <report>maven-file-activity-plugin</report>
    [...]
Running maven site generates
the reports shown in Figure
4-12 and Figure
4-13.
Both of these reports internally use the Changelog plug-in that you'll learn about in the
next lab. You can configure them by using Changelog plug-in
properties, such as the maven.changelog.range property that controls
the report timeframe.
[4] SourceForge's current ranking formula is: log (3
* # of
forum posts for that week) +
log (4 * #
of tasks ftw) +
log (3 *
# bugs ftw) +
log (10 *
patches ftw) +
log (5 *
tracker items ftw) +
log (# commits to CVS
ftw) + log
(5 * #
file releases ftw) +
log (.3 *
# downloads ftw).
[5] Unfortunately, no such tool exists for Subversionâbut it won't be long before one does.
Get Maven: A Developer's Notebook now with the O’Reilly learning platform.
O’Reilly members experience books, live events, courses curated by job role, and more from O’Reilly and nearly 200 top publishers.

