You should be fairly comfortable investigating the HTML and CSS tabs because you encountered the same content during your earlier escapade with the Inspect button. Still, a somewhat subtle feature worth pointing out is that you can right-click on items in either of these tabs to reveal a contextual menu with several useful options in it. Among these options are the ability to scroll the page to the element of interest, log events related to the element, directly modify the element, and so on.
A superset of the same content that appears under the CSS tab also appears in the HTML tab if you select the underlying Style tab, included in a pane on the right. Note that you can directly change the style of elements through the CSS tab, as shown in Figure A-8, or through the HTML tab. You can also click on a style element to disable it in the page depending what is most helpful for your particular situation. And wait, there's more: the Layout tab that's adjacent to the Style tab displays the active properties for the currently selected element's padding, borders, margins, and offset. As might be expected, you can preview changes to these properties by changing the values directly in the diagram.
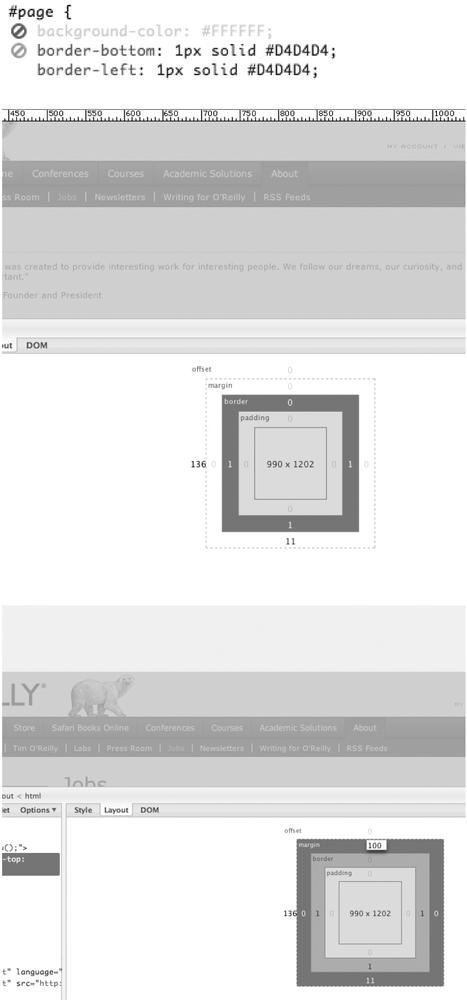
Figure A-8. Top: disabling elements; middle: Firebug's Layout ruler; bottom: manipulate the layout of a DOM element's margin, or anything else for that matter (this example shows the upper margin being changed to 100px)
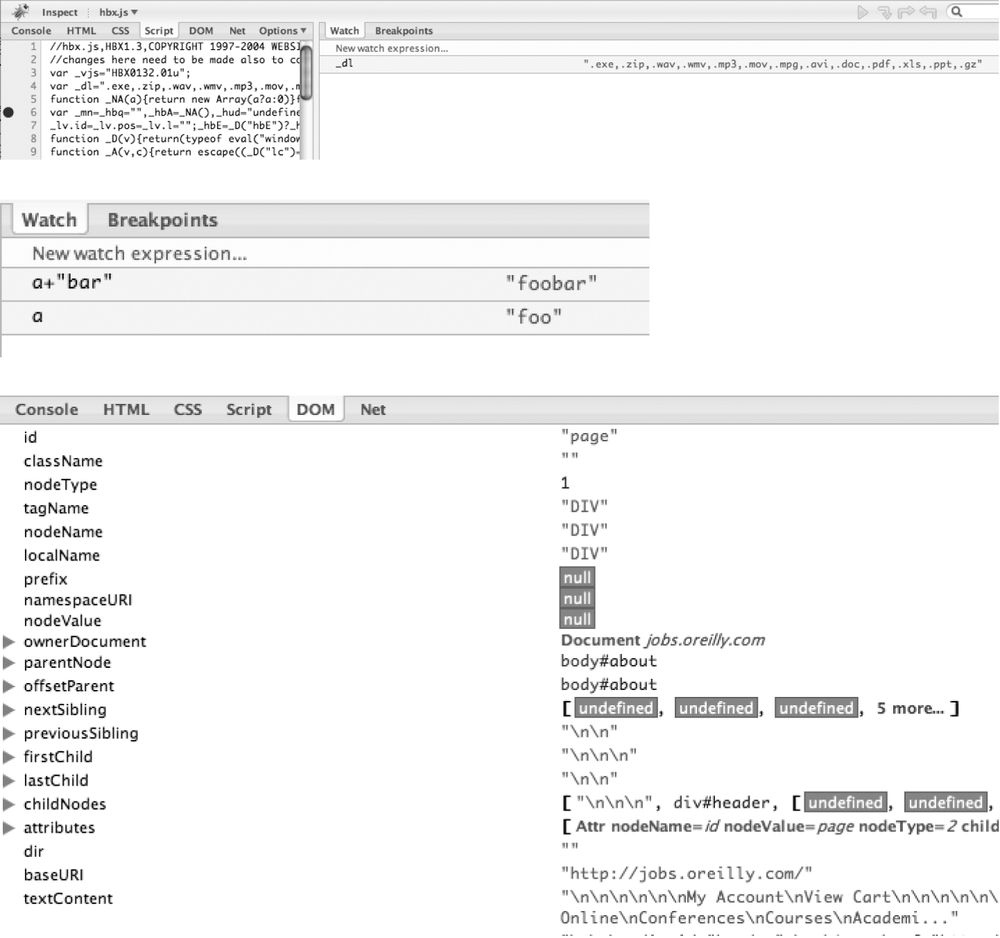
Firebug's Script tab reveals a powerful JavaScript debugger that allows you to set breakpoints in particular scripts and watch the values of variables in the code as it executes. Unlike some debuggers you may have previously encountered, the Firebug JavaScript debugger is intuitive and easy to learn. To set a breakpoint, just load the script of interest by using the contextual menu just above the Script tab and click on the line number where you want the breakpoint. A small red circle should appear, confirming the breakpoint. You can click on the red circle to remove the breakpoint, or click on additional lines of code to add additional breakpoints. Likewise, you can type in the name of a variable or a derived expression into the accompanying Watch tab to keep an eye on how values are changing from breakpoint to breakpoint. Is debugging JavaScript getting easier, anyone?
The DOM tab, shown in Figure A-9, is fairly self-explanatory and essentially provides the same information you can already view in the HTML tab, but in a tree view it might be easier to inspect and manipulate, depending on the situation.
Get Dojo: The Definitive Guide now with the O’Reilly learning platform.
O’Reilly members experience books, live events, courses curated by job role, and more from O’Reilly and nearly 200 top publishers.

