Response Metric Scorecards
As with Skill Metrics, a simple way to track metrics is to create a spreadsheet where you enter the data elements and the metrics are then calculated. You might have separate spreadsheets for each product, perhaps summarizing results over chosen timeframes like by month or by quarter—or you might have one spreadsheet that tracks multiple projects over a given timeframe.
As mentioned in the previous chapter, I find Google Docs very suitable to the purpose of inputting the data, calculating the Response Metrics, dynamically creating charts, and sharing the results securely with members of the software development team. I typically keep a separate spreadsheet for each quarter (each three month period), and I track all the software projects in the single spreadsheet. Every project has a separate “scorecard,” which is a separate sheet where the data for that project is entered. I summarize the data for user activations and deactivations in one part of the sheet, and separate areas are used for tracking data on the trials, the key benefits, and the user issues. Figure 5-4 shows a sample project response scorecard for three months, with the Response Metrics calculated at the top.
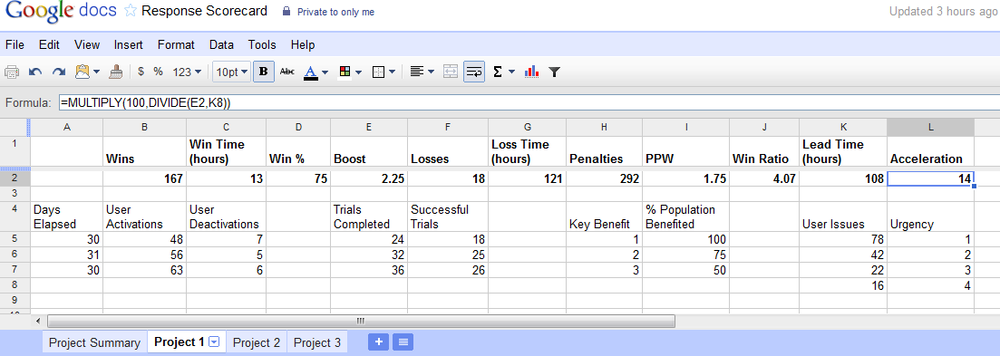
Figure 5-4. A sample Response Metrics spreadsheet for a project during a three-month period
The metrics for multiple projects can then be summarized on a single sheet, and key chosen metrics ...
Get Codermetrics now with the O’Reilly learning platform.
O’Reilly members experience books, live events, courses curated by job role, and more from O’Reilly and nearly 200 top publishers.

