One simple way to calculate and track metrics is to use spreadsheets. I have found Google Docs to be a great way to enter data, automatically calculate the latest metrics, and then share them online with the team. The charting features of Google Docs spreadsheets make it easy to present data visually when appropriate, too.
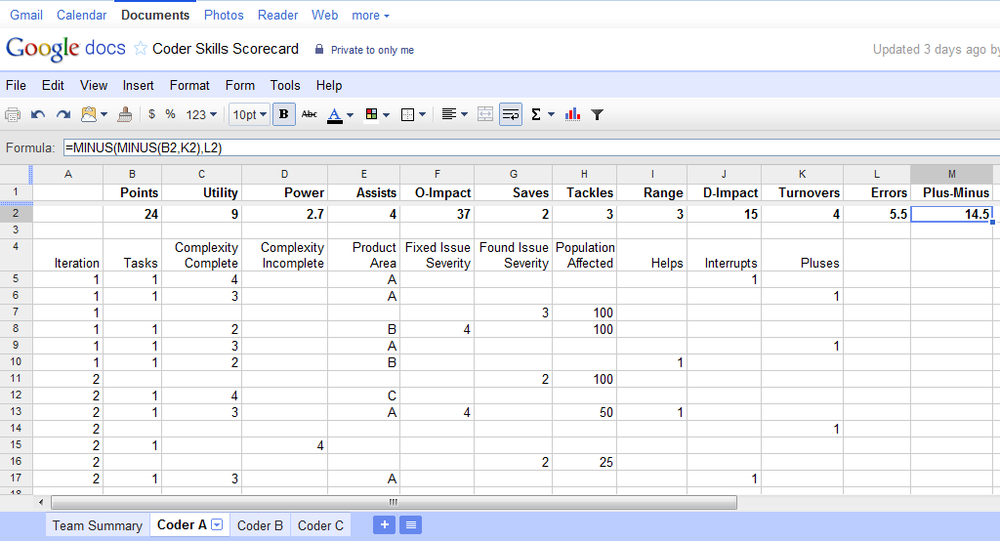
Keeping a single spreadsheet per project, per project team, you can enter data after each development iteration. See Figure 4-5, which shows a skills “scorecard” for an individual coder. In this example, you enter data rows for tasks or production issues, and as you enter data, the current to-date metrics are calculated at the top. You can enter the data one task or issue at a time, or you can summarize multiple sets of data into a single row (although this particular format has some limitations around entering summary data). The calculations at top are based on the data entered below. In this case the metrics are all calculated as Totals, but you could easily create versions that calculate Averages, Minimums, Maximums, or other desired values.
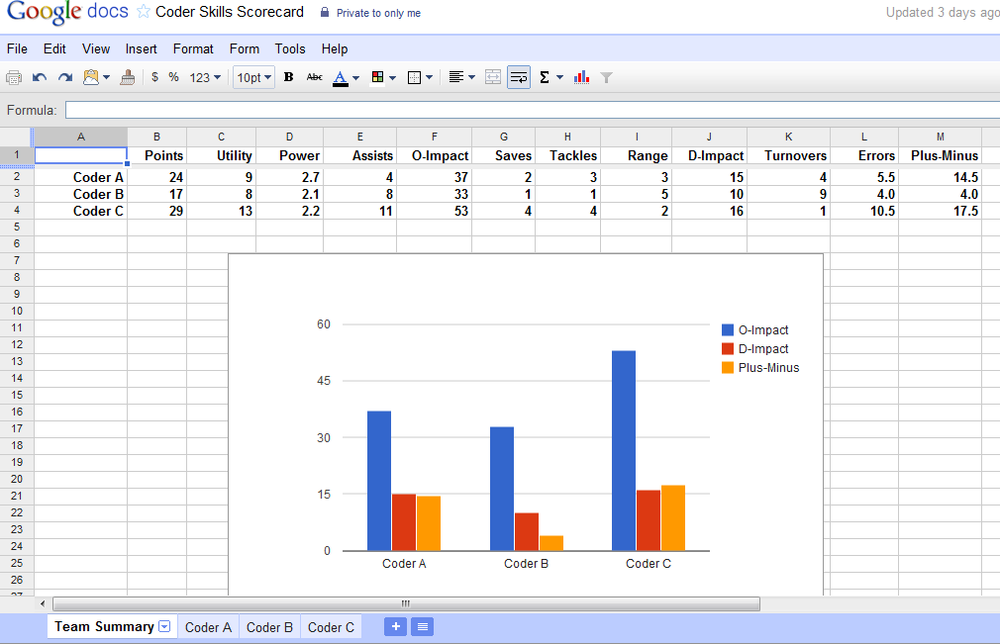
You can have a worksheet for every coder, and then a summary page to view the current metrics for all the coders. It may also be useful to include a chart on the summary page, to highlight key metrics and how the coders on the team compare. Figure 4-6 shows an example summary sheet with chart.
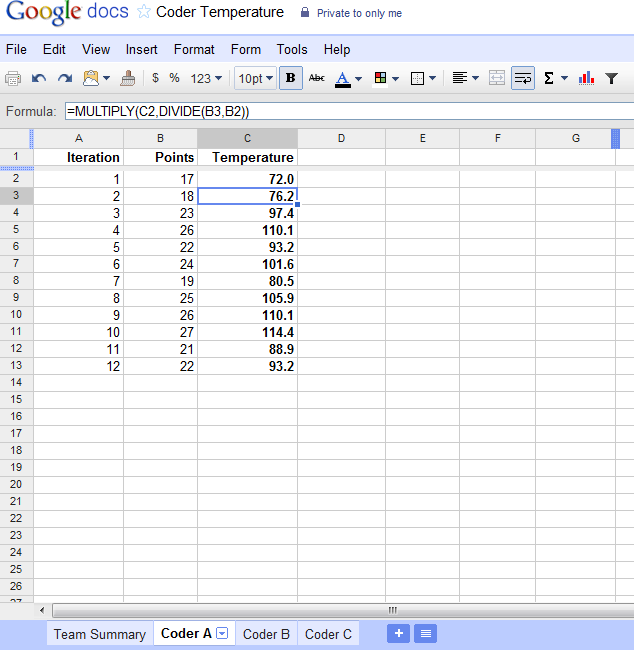
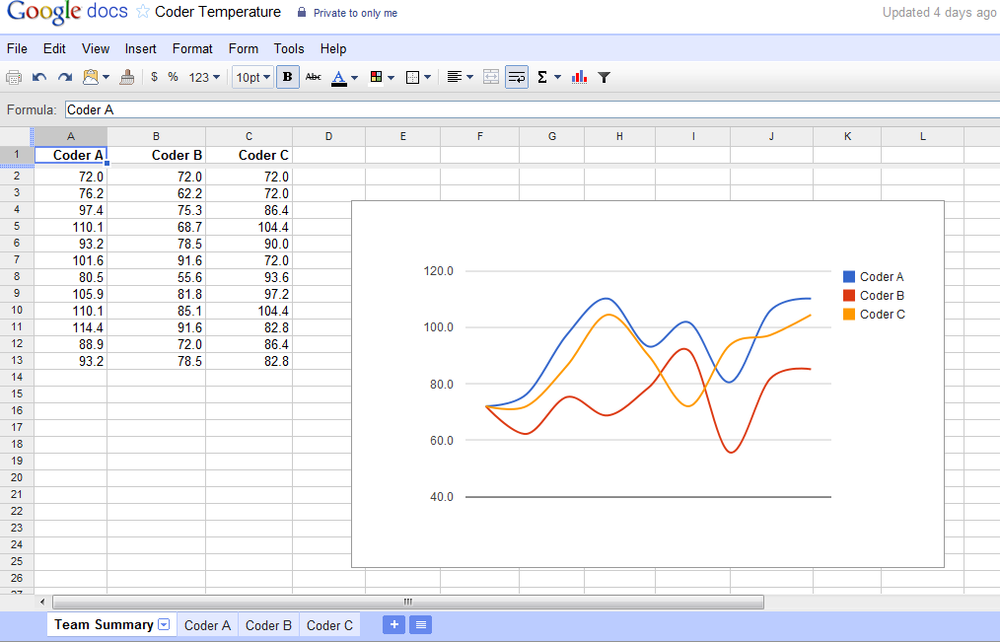
For certain metrics, either because calculation requires data in a different format or because you would like separate charting or trending, you may decide to have a separate spreadsheet. Figure 4-7 shows a tracking sheet to calculate the Temperature metric for a coder. You enter the Points per iteration, and the sheet shows the Temperature after every iteration. The summary sheet shown in Figure 4-8 lists the Temperature after each iteration for all the coders on the team, and the chart shows the trend line for each coder.
Get Codermetrics now with the O’Reilly learning platform.
O’Reilly members experience books, live events, courses curated by job role, and more from O’Reilly and nearly 200 top publishers.

