Viewing reports
Finally, we are ready to see the results of all the work done previously. Navigate to Monitoring | IT services and you should see a report like this:
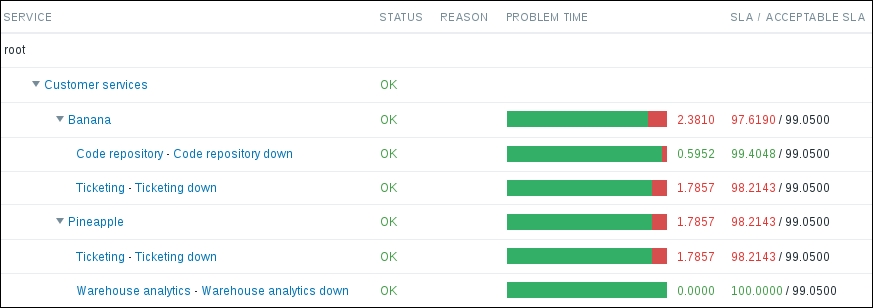
It shows the current state of each service, the calculated SLA value, and whether it meets the projected value. In this example, out of three services, only one has met the SLA level: the Warehouse analytics service. You are most likely seeing a different result.
The bar does not actually represent 100%—if you compare the value with how much of the bar is colored red, it does not seem to match. Move the mouse cursor over any of the bars to see why:
This bar only displays the last 20%
Get Zabbix Network Monitoring - Second Edition now with the O’Reilly learning platform.
O’Reilly members experience books, live events, courses curated by job role, and more from O’Reilly and nearly 200 top publishers.

