There was a time when we had to install different extensions to use development tools in different browsers. Now, development tools have become the norm in the latest versions of all modern browsers. These tools provide a wide range of facilities to debug your code. The following screenshot previews the developer tools section of the Chrome browser:
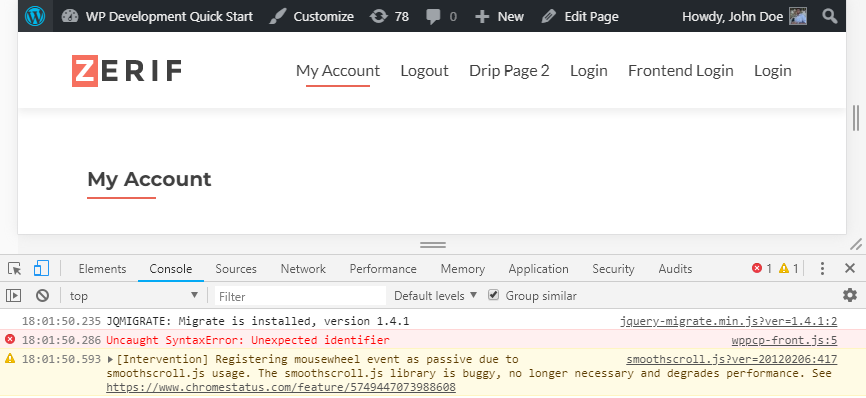
The preceding screenshot previews the Console tab, where you will see errors, notices, and information related to user requests. This tab simplifies the process of tracking and fixing errors in your client-side coding. We can also use other ...

