15.13 Finding Bottlenecks with NProf
Premature optimization is the root of much development evil. On the other hand, sometimes you need to find out why your application is performing poorly. How do you find out where the delays are? Littering your code with debug statements trying to track down bottlenecks is a really bad use of time.
NProf can help you identify bottlenecks with a simple user interface to monitor your application. Additionally, it provides a separate API if you want to manually instrument your code.
| |
|---|---|
Tool | NProf |
Version covered | 0.9 alpha (Note: the tool is quite stable despite its “alpha” designation) |
Home page | |
Power Tools page | |
Summary | Simple profiler for finding bottlenecks in .NET apps. Supports ASP.NET profiling. |
License type | GPL, LGPL |
Online resources | Documentation, mailing list, forums, bug tracker |
Supported Frameworks | .NET 1.1, 2.0 |

Getting Started
NProf’s binary distribution is an executable installer file. Run that and start NProf from the NProf folder added to the Start menu. NProf’s UI will start up, ready for you to create a new profiling project (Figure 15-36).
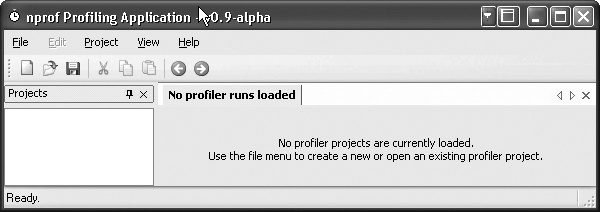
Figure 15-36. NProf’s initial screen
Using NProf
To put NProf to work, you must first create a project to hold ...
Get Windows Developer Power Tools now with the O’Reilly learning platform.
O’Reilly members experience books, live events, courses curated by job role, and more from O’Reilly and nearly 200 top publishers.

