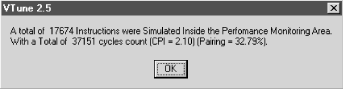
VTune, we discovered, is targeted specifically for programs that execute on Intel hardware, and provides a very detailed and informative analysis of program execution behavior on the Intel Pentium processor family. It turns out that this analysis is not as useful for programs executing on newer Intel hardware, such as the Pentium Pro, Pentium II, Pentium III, or Pentium IV. However, learning how to use this detailed information requires quite a bit of understanding about the way that Pentium (and Pentium Pro) processor chips work.
The Intel IA-32 architecture is based on the original third-generation 32-bit 386 processor family. Today, the Intel 32-bit architecture is associated with Pentium (P5) and Pentium Pro, Pentium II, Pentium III, and Pentium IV processors (these four correspond to the P6 generation of Intel microprocessors). For example, the Pentium IV is a sixth-generation microprocessor (P6) running the Intel x86 instruction set. Hardware designers refer to the Intel x86 as a CISC (Complex Instruction Set Computer), a style of hardware that is no longer in vogue. Today, hardware designers generally prefer processor architectures based on RISC (Reduced Instruction Set Computers). The complex Intel x86 instruction set is a legacy of design decisions made twenty years ago at the dawn of the microprocessor age, when RISC concepts were not widely recognized. The overriding design consideration in the evolution of the Intel x86 microprocessor family is maintaining upward compatibility of code developed for earlier-generation machines produced over the last twenty years.
Table 4-1 summarizes the evolution of the Intel x86 microprocessor family starting with the 8080, first introduced in 1974. As semiconductor fabrication technology advanced and more transistors were available to the designers, Intel’s chip designers added more and more powerful features to the microprocessor. For example, the 80286 (usually referred to as the 286) was a 16-bit machine with a form of extended addressing using segment registers. The next-generation 386 chip maintained compatibility with the 286’s rather peculiar virtual memory addressing scheme while implementing a much more straightforward 32-bit virtual memory scheme. In contrast to the 16-bit 64K segmented architecture used in the 286, the 386 virtual addressing mode is known as a “flat” memory model.
Table 4-1. The evolution of the Intel x86 microprocessor family
|
Processor |
Year |
Clock speed (MHz) |
Bus width (bits) |
Addressable memory |
Transistors |
|---|---|---|---|---|---|
|
8080 |
1974 |
2 |
8 |
64 KB |
6,000 |
|
8086 |
1978 |
5-10 |
16 |
1 MB |
29,000 |
|
8088 |
1979 |
5-8 |
8 |
1 MB |
29,000 |
|
80286 |
1982 |
8-12 |
16 |
16 MB |
134,000 |
|
80386 |
1985 |
16-33 |
32 |
4 GB |
275,000 |
|
486 |
1989 |
25-50 |
32 |
4 GB |
1,200,000 |
|
Pentium (586) |
1993 |
60-233 |
32 |
4 GB |
3,100,000 |
|
Pentium Pro (686) |
1995 |
150-200 |
32 |
4 GB |
5,500,000 |
|
Pentium II (686) |
1997 |
233-333 |
64 |
4 GB |
7,500,000 |
|
Pentium III (686) |
1999 |
400-800 |
64 |
64 GB |
> 15,000,000 |
|
Pentium IV (686) |
2001 |
1200-1700 |
64 |
64 GB |
40,000,000 |
The extra circuitry available in
the next-generation 486 processors introduced in 1989 was utilized to
add architectural features to create even higher performance chips.
The 486 microprocessor incorporated floating-point instructions
(available in an optional coprocessor during the days of the 386) and
a small 8K Level 1 code and data cache. Including a small cache
memory meant that the 486 could also speed up instruction using
pipelining. Pipelining is a common processor
speedup technique that exploits an inherent parallelism in the
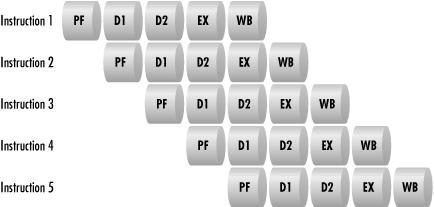
process of decoding and executing computer instructions. The 486
breaks instruction execution into five stages, as illustrated in
Figure 4-11:
Prefetch. During Prefetch, the next instruction to be executed is copied from cache memory to the CPU.
Instruction Decode, Part 1 (op code interpretation).
Instruction Decode, Part 2 (operand fetch).
Execution.
Write Back. Registers and memory locations are updated.
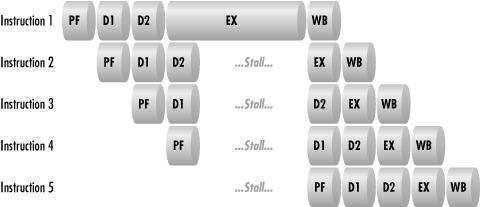
Since an instruction will spend at least one clock cycle in each stage of execution, a 486 instruction requires a minimum of five clock cycles to execute. In other words, a 486 processor running at a clock speed of 100 MHz should be able to execute 100,000,000 ÷ 5 = 20,000,000 instructions per second. The Level 1 processor cache memory, first available among the Intel family of microprocessors in the 486 machines, is critical to the performance of a pipelined CPU. As long as the addresses and data areas referenced in the instruction are resident in the CPU cache, the microprocessor executes each instruction stage in one clock cycle. On the other hand, there is a significant performance penalty if data or instructions have to be fetched from main memory. The CISC architecture used in the Intel x86 family of microprocessors is also a significant performance factor because many 486 instructions require more than one clock cycle in the Execute stage. (The essence of pure RISC designs is that only simple instructions that can execute in a single clock cycle are implemented.)
Separate pieces of hardware circuitry in the processor are responsible for carrying out the processing associated with each stage in the execution of a machine instruction. The specific logic circuitry associated with executing each stage of an instruction is idle during other stages of instruction execution in simple, nonpipelined processors. The idea behind a pipeline is to utilize this hardware by attempting to overlap instruction execution. As illustrated in Figure 4-12, the 486 pipeline has the capacity to execute five instructions in parallel: as soon as Instruction 1 completes its prefetch stage, the prefetch hardware can be applied to the next instruction in sequence. When the 486 pipeline is working optimally, even though each individual instruction still takes five clock cycles to execute, an instruction completes every clock cycle! The behavior of a pipelined processor architecture leads quite naturally to measuring its performance according to the number of clocks per instruction (CPI). Pipelining boosts the actual instruction rate of a microprocessor from 5 CPI for the non-pipelined version to 1 CPI for the pipelined processor (under ideal circumstances, as we shall see).
In practice, CPIs in the range of one clock per instruction are not achievable even in the very best textbook examples of RISC processor design. Some of the problems are endemic to the technology. Various instruction sequences result in pipeline stalls that slow down instruction execution rates; branch instructions that change the sequence of instruction execution cause the wrong instructions to be loaded and decoded when the branch that changes the sequence is executed. Consequently, processors like the Pentium and Pentium Pro use branch prediction strategies to keep track of when branches were taken in the past and to load the pipeline with instructions out of sequence based on history.
Mispredicted branches are not the only source of pipeline stalls. Often it is necessary to stall the pipeline because the output from one instruction is required by the next instruction. When one instruction updates a register and the instruction that follows uses that same register to address data, it is necessary to stall the pipeline in the address generation stage for the second instruction. A pipeline stall with a dependent relationship between instructions that execute near each other is known as an interlock.
Pipeline stalls due to mispredicted branches and interlocking
instruction dependencies are common to both RISC and CISC machines.
Intel’s experience with speeding up the 486’s instruction
execution rate using simple pipelining floundered for a different
reason: the x86 complex instruction set. Complex x86 instructions
require more than one clock cycle in the execution stage. Reviewing
the specifications in Intel’s documentation, you can see that
the basic commands in the integer instruction set require between one
and nine clock cycles. The rep prefix used in the
commonly used bulk memory Move instructions alone requires four
clocks, for example. A 32-bit far call, used for branching to and
from a subroutine, can require as many as 22 clock cycles. This
variability in instruction execution time plays havoc with the
486’s five-stage pipeline, causing frequent stalls in the EX
stage, as depicted in Figure 4-13. The drawing
illustrates a 486 pipeline stall because Instruction 1’s EX
cycle requires five clocks to complete. You can see how a stall in
one instruction backs up the entire pipeline. Because some complex
instructions require many clock cycles to execute, the 486’s
instruction execution rates fell well short of optimal performance.
As the next-generation semiconductor fabrication technology became available, Intel’s chip designers faced a quandary. Some pipelining performance issues can be readily addressed with more hardware, so the P5 or Pentium chip gained separate code and data caches as well as branch prediction logic. (The Pentium’s use of branch prediction was subject to a well-publicized patent infringement suit brought by Digital. The litigation was settled out of court in 1998.) But the performance issues related to the x86 complex instruction set resisted a simple hardware solution.
The Pentium introduced a superscalar dual pipeline architecture that allows, under the right circumstances, two instructions to be completed in a single clock cycle. The Pentium dual pipeline is illustrated in Figure 4-14. The Pentium contains a single Prefetch engine capable of operating on dual instructions in parallel. The Pentium can then load the two instruction execution pipelines in parallel. Where a pipeline computer is theoretically capable of executing instructions at a rate of one CPI, a superscalar machine such as the Pentium is capable of an instruction execution rate that is less than one CPI. The top pipeline in the Pentium superscalar pipeline is known as the U pipe,and its execution characteristics are identical to those of the 486. The bottom pipeline is called the V pipe and is loaded only under special circumstances.

The Pentium Prefetch stage follows arcane instruction pairing rules that determine whether the second instruction in an instruction pair can be loaded in the V pipe and executed in parallel. The rules for loading the V pipe are fairly complex. Two simple, single-cycle execution instructions can almost always be paired and executed in parallel. Some authorities have observed that the Pentium instruction pairing rules identify a subset of RISC instructions inside the full, complex instruction set that can be executed in parallel. This characterization is a bit simplistic, however. Any instructions that use immediate operands or addresses (i.e., the data the instruction operates on is embedded in the instruction) can never be paired. Furthermore, if the second instruction operates on any of the same registers as the first, it cannot be executed in parallel. This is a particularly strict requirement in the x86 environment, where there is a legacy of only eight General Purpose Registers. The small number of registers available to instructions leads to a few registers being referenced repeatedly, which leads to pipeline instruction dependency interlocks.[14]
Like pipelining, the superscalar architecture in the Intel 586 borrowed techniques in widespread use in the computing industry. The hardware manufacturers that introduced superscalar architectures in the late 1980s also developed their own systems software, including the compilers that generated code optimized to run on these machines. These RISC hardware manufacturers relied on their compilers to generate code that would run optimally in a parallel environment and take full advantage of the specific hardware architecture. An optimizing compiler, for example, may resort to inserting placeholder instructions into the instruction sequence or rearranging instructions to avoid sequences with direct dependencies between successive instructions.[15]
In the open PC environment, Intel holds an enviable position as the developer of the hardware used in most PC desktop, workstation, and server machines. However, Intel develops very little of the systems software that run on its hardware, including the most popular operating systems and high level language compilers. Intel’s challenge when it introduced the Pentium superscalar architecture was to promote the use of this hardware among third-party systems software developers, including the leading developer of compilers and operating systems for the Intel platform, which is Microsoft.
Intel’s approach to promoting the Pentium architecture was to provide two types of tools for use by third-party developers. The first was to build into the processor a measurement interface that third-party software could tap into. The measurement interface for the Pentium and subsequent machines provides extensive instrumentation on internal processor performance. It includes the ability to measure the actual CPU instruction execution rate (not just how busy the processor is, as in native Windows 2000 measurements), the number of paired instructions that executed in the V pipe, and various metrics that deal with pipeline stalls. The hardware measurement interface lets you collect just two of the available metrics at a time.
A utility called CPUMON, available from http://www.sysinternals.com, allows you to enable the Pentium counters and access them using the Windows System Monitor. Pentium performance counters can also be accessed under Windows NT by installing the P5 counters, using software Microsoft distributes as part of the Windows NT 4.0 Resource Kit. We illustrate some of the uses of these Pentium counters in the next chapter in the context of multiprocessing, where they are especially useful. As of this writing, Microsoft has not released a version of its Resource Kit software to access the Pentium counters that runs on Windows 2000.
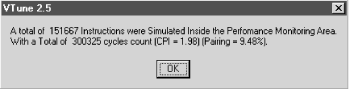
The second tool Intel provides is VTune, which performs two key functions that developers can use to optimize the code they develop. The first provides a very usable interface to the built-in Pentium measurement interface. Using this interface, VTune can be used to collect internal Pentium performance statistics on a program as it executes. The second key aspect of VTune is the capability to analyze code sequences and make recommendations on how to write code that is optimal for the Pentium. Among other things, VTune computes the CPI for an instruction sequence and calculates the utilization of the V pipe; see Figure 4-15.
With this background, we can now return
to VTune’s analysis of the NextInstanceDef subroutine that was
identified as a hotspot within the dmperfss
program, as depicted back in Figure 4-10.
The Microsoft Visual C++ compiler generated the six lines of very tight machine code for this subroutine from the following C language statements:
PERF_INSTANCE_DEFINITION * NextInstanceDef
            ( PERF_INSTANCE_DEFINITION *pInstance )
{
    PERF_COUNTER_BLOCK  *pCtrBlk;
    pCtrBlk = (PERF_COUNTER_BLOCK *)
      ((PBYTE)pInstance + pInstance->ByteLength);
    return    (PERF_INSTANCE_DEFINITION *)
     ((PBYTE)pInstance + pInstance->ByteLength + pCtrBlk->ByteLength);
}
This C language helper function advances a pointer inside the buffer
of data returned by RegQueryEx from the beginning of one object
instance to the next occurrence of an instance. When
dmperfss is retrieving instanced data,
particularly data associated with processes and threads, this code is
called repeatedly to parse the performance data buffer. As we have
seen, all three performance profiler products identified this segment
of code as an execution hotspot in the program. In the VTune analysis
of dmperfss, the NextInstanceDef code segment was
executed even more frequently because both process and thread data
was being collected. The profiling data strongly suggests that the
efficiency of the program can be optimized by improving the
performance of this specific segment of code.
The code generated by the Microsoft compiler to carry out these C language statements is a sequence of admirably compact machine language instructions:
00408D40   mov        ecx,dword ptr [esp+4]
00408D44   mov        edx,dword ptr [ecx]
00408D46   mov        eax,dword ptr [ecx+edx]
00408D49   add         eax,ecx
00408D4B   add         eax,edx
00408D4D   ret
The code analysis VTune performs on the machine language instructions in NextInstanceDef (illustrated in Figure 4-10) indicates that none of these frequently executed instructions is capable of being executed in parallel on a Pentium. The total lack of parallelism comes despite the fact that these are all simple one- and two-cycle instructions. The screen legend in the right-hand corner of the VTune display in Figure 4-10 decodes the visual clues the program provides to instruction execution performance. Instructions that can be paired and executed in parallel are clearly indicated, as are the boundaries of code cache lines. The P5 optimization switch on the VC++ compiler generates NO OP instructions to line up code on cache line boundaries, as shown here.
This code is unable to take advantage of the Pentium’s
parallelism. VTune informs us that the machine code instructions
generated by the compiler stall the U pipe. The column marked
“Penalties and Warnings” indicates that the second and
fourth MOV (move) instructions cause an address
generation interlock (AGI) that stalls the U pipe. Notice that each
instruction in this routine is executed once and only once each time
through the routine. There are no branches. However, the instruction
timings VTune reports, based on its sampling of the program as it was
running, show a wide variation in the execution time of the
individual instructions in this code sequence.
The instruction execution timings VTune reports clearly show the
performance impact of stalling the pipeline. The second
MOV instruction, requiring two clock cycles to
execute, is found in execution 2.48% of the time. This instruction
copies the value at the address pointed to by the
EAX register into the ECX work
register. The previous instruction sets up the EAX
address using a parameter passed on the stack pointer
(ESP). There is an obvious dependency between
these two instructions. The next instruction adds a value to
ECX. The code is doing arithmetic on another
address pointer and uses this value in the MOV
instruction that follows. Because the first MOV stalls the pipeline,
the ADD instruction that follows is found to be in
execution 11.6% of the time. Continuing the analysis, we see how
pipeline stalls propagate through the instruction sequence. The next
MOV instruction (another two-cycle instruction) is
in execution 3.86% of the time, while the single one-cycle
ADD that follows it was found to be in execution
14.86% of the time!
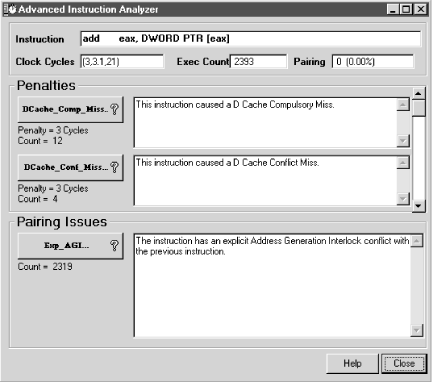
Faced with this situation, a programmer working in assembly language
can rework the machine instructions to avoid the address generation
interlock problem easily enough by adding a third work register. The
more complicated code sequence actually runs several times faster
than the original. VTune provides detailed advice to the assembly
language programmer concerning Pentium-specific instruction execution
performance issues, as illustrated in Figure 4-16.
The ADD instruction analyzed has an obvious
problem due to the interlock with the previous instruction. But it
also occasionally requires the data referenced by the
EAX register to be refreshed from memory, rather
than using the copy that was found in the data cache.
To take advantage of all the detailed performance information on instruction execution that VTune provides, an application programmer working in a C++ language development environment faces three choices. The first and easiest option is to tell the compiler to generate code optimized for the Pentium processor. Naturally, we tried that route first, recompiling the program with the P5 optimizing switch. Afterwards, running VTune again, we noted some changes in the sequence of instructions generated for this routine, but nothing was an extensive enough restructuring of the program logic to show any appreciable improvement. Figure 4-17 summarizes a run we made after instructing the compiler to generate code optimized for the Pentium. The CPI shows a slight reduction compared to Figure 4-15, although, curiously, the percentage of paired instruction execution actually dropped. Of course, CPI is the more important indicator of performance.
The second option is to replace the code generated by the compiler with an inline assembly language routine. We did experiment with that option in this instance and were very satisfied with the performance improvements that resulted, despite the fact that adding another work register made the code longer and somewhat more complicated. This counterintuitive outcome is not unusual for a RISC machine, which can often execute longer code sequences faster than shorter, more compact ones. The third option is to recode the original C language routine, which is the route we believe was suggested in this instance to address the number of times this helper function is being called. We tackled the lengthy code restructuring project in the next development cycle, and we continue to rely on Rational Visual Quantify and Intel VTune to measure the impact of those improvements.
As complicated as the superscalar, parallel processing, pipelined P5 hardware is, Intel’s current generation of P6 Pentium Pro, Pentium II, Pentium III, and Pentium IV hardware is even more complicated. The simple parallel U and V pipelines of the Pentium are replaced by a complex microarchitecture that addresses x86 instruction execution issues from an entirely different direction. The P6 microarchitecture attempts to perform instruction coding optimizations automatically during instruction execution, reducing the need to perform Pentium-style instruction sequencing manually (or automatically during compiler code generation). This change of direction suggests that the use of VTune to fine-tune instructions was neither as widespread or as successful as Intel had hoped.
The Intel 686 family of microprocessors were also the first models explicitly designed with advanced multiprocessor configurations in mind. We take up the topic of multiprocessing in the next chapter. Intel also expanded the range of hardware performance measurements available on the P6 machines to support more complex multiprocessor configurations.
As discussed previously, instruction pairing in the Pentium was limited to a relatively small subset of the available instruction set. To get the most mileage out of the Pentium hardware, compilers had to be revised, and C language programs that ran on the 486 had to be recompiled for the P5. Of course, being forced to maintain two separate and distinct sets of load modules, one optimized for the 486 and the other for the Pentium, is problematic, to say the least. But without recompiling older programs to make more use of the simple RISC-like instructions that can be executed in parallel on the Pentium, owners of Intel machines do not reap the full benefits of the new and potentially much faster hardware. A second issue in generating optimal code for the Pentium was the problem illustrated in previous sections. Having very few General Purpose Registers to work with makes it difficult to write x86 code that does not stall the pipeline and can take full advantage of the superscalar functions.
Increased logic capacity in newer generation chips makes a more complex parallel processing architecture possible in the P6, PII, PIII, and PIV. The limitations imposed by the original x86 instruction set forced a change in direction. Without fundamental changes, Intel would not have succeeded in further boosting the Instruction Execution Rate (IER) of its next-generation chips beyond what can be achieved by simply increasing clock speed. Among other things, the P6 microarchitecture was designed to address specific performance limitations that arose in the P5 generation of machines, allowing the Intel legacy CISC architecture to keep pace with current advances in RISC processor technology.
The P6 microarchitecture addresses some of these specific performance issues to permit an even greater degree of parallel execution of instructions. Figure 4-18 illustrates the major elements of the P6 instruction execution pipeline, which is considerably more complex than the P5 structure. Additional parallelism is introduced because as many as three instructions at a time can be decoded in parallel during a single clock cycle. The level of parallelism that can be achieved still depends on the instruction execution sequence because, as depicted, the P6 contains two simple instruction decoders and one complex instruction decoder, all designed to work in parallel. Since the complex instruction decoder can decode simple instructions (but not vice versa), a sequence of three simple instructions can be decoded in a single clock cycle. On the other hand, a sequence of three complex instructions requires three clock cycles to decode because there is only one set of complex instruction decoder logic on board the chip.
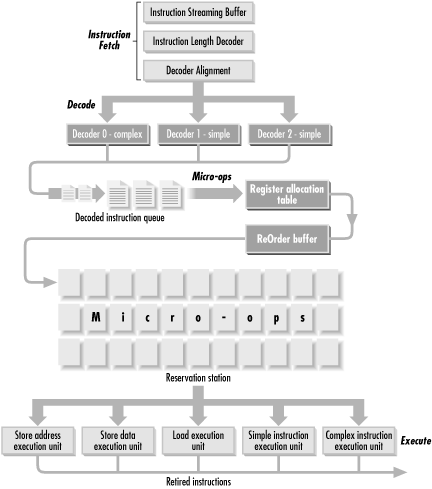
In
the P6 architecture, decoding instructions means translating them
into a RISC-like set of fixed length micro-operations, or
micro-ops. Most micro-ops are designed to
execute in a single clock cycle. To augment the limited number of
GPRs available to the machine language programmer, these micro-ops
can draw on 40 internal work registers, or
pseudo-registers. After unwinding CISC machine
instructions into RISC-like instructions, micro-ops are stored in a
pool called the Reservation Station from which they can be executed
in any order.[16] The dispatch unit of the processor,
which can execute up to five micro-ops in parallel in a single clock
cycle, contains five different functional execution units, as shown.
A simple micro-op instruction, a complex micro-op, a Load operation,
a Store Data operation, and a Store Address operation can all be
performed in parallel. Out-of-order execution means that any Load
micro-op waiting in the Reservation Station is eligible to be
executed by the Load execution unit if it is free. When all the
micro-ops associated with a given machine language instruction are
completed, the instruction itself is said to be
retired. Retiring instructions also means that
any results are written back to the computer’s registers and
cache memory. The processor’s retirement unit can retire up to
three instructions per clock cycle, with the restriction that these
must be in strict order according to the original instruction
execution stream.
Intel engineers extensively reworked the hardware performance monitoring interface for the P6 family of microprocessors. Figure 4-19 illustrates using the CPUMON freeware utility available from http://www.sysinternals.com to turn on the P6 counters. Like the P5 facility, the P6 allows you to look at only two measurements at a time. Figure 4-19 illustrates turning on a counter that measures the rate at which instructions are retired, along with a measurement of internal activity resource stalls that reflects pipeline efficiency. This Instructions Retired/sec counter corresponds to the processor’s internal Instruction Execution Rate, a straightforward and valuable measurement of processor performance.

It should be apparent from Figure 4-19 that the P6 hardware performance monitoring interface provides a wealth of performance statistics on almost every aspect of processor performance. Various aspects of the cache, internal bus, floating-point unit (FPU), etc., are instrumented. Understanding what many of these arcane measurements mean may require a trip to the Intel processor documentation library at http://developer.intel.com. The meaning of the specific performance counter we selected here, I nstructions Retired, ought to be obvious from the preceding discussion of the P6 microarchitecture. You probably know enough about the P6 microarchitecture at this point to use the Instructions Decoded metric, or possibly even the Resource Stalls counter, which reports the number of clock cycles where no instructions could be retired due to various types of execution pipeline stalls.
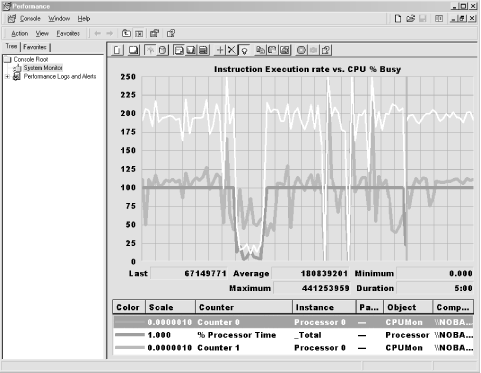
Figure 4-20 illustrates using System Monitor to
track the Instruction Execution Rate of a 400 MHz Pentium II machine.
Inside System Monitor, we selected Counter 0 and Counter 1 under the
CPUMON object, corresponding to the Instructions Retired/sec and
Resource Stalls/sec hardware measurements. We used the Pinball game
application (again, an excellent CPU load generator) to generate a
load on the system that drove processor busy to 100%, as shown. With
the processor running at 100% busy, this machine is executing (or
retiring) approximately 200,000,000 instructions
per second, or about two clocks per instruction. During a peak
interval, as many as 440,000,000 instructions per second executed,
depending on the specific program routines that were running. Despite
some variation, IER certainly appears to be well correlated with the
measure of
% Processor Time CPU busy that Windows
2000 reports conventionally. In this example, when IER dips, there is
a corresponding dip in % Processor Time. Naturally, the IER you
measure on your machines is a function of the specific instruction
stream being executed—if you run Pinball, you are liable to
make a similar CPI calculation. But different workloads with
different instruction mixes will yield very different results.
The P6 microarchitecture is designed to construct automatically the
sort of optimized code sequences that the programmer had to craft by
hand using VTune. In fact, VTune cannot perform the kind of analysis
illustrated here on code instruction sequences for the much more
complicated P6. How effective the complex P6 architecture actually is
in optimizing code sequences remains an open question. The
dmperfss performance data collected by VTune that
was reported in Figure 4-10 was collected on a
Pentium Pro running at 200 MHz. From these results, it is evident
that the P6 did not parallelize this instruction sequence very
successfully. The P6 microarchitecture apparently could not eliminate
the pipeline stalls caused by address generation interlock in this
code sequence. This is a clear indication that VTune will continue to
play a valuable role in helping programmers optimize the performance
of Windows 2000 applications.
As this book is going to press, Intel is beginning to introduce seventh-generation P7 microprocessors that are capable of executing native 64-bit instructions, clocked at 1 Ghz and higher speeds. The first P7 64-bit chips are called Itanium processors. The Intel IA-64 P7 architecture is, naturally, even more complicated than the P6. The Itanium microprocessor chip incorporates three levels of cache memory, not just two like the P6 does. It provides 128 internal pseudo-registers. It is designed to support an even greater level of parallel processing than the P6 machines, with a ten-stage pipeline and four distinct integer and four MMX instruction execution units, all capable of executing instructions in parallel. Like the P6, the P7 contains separate Load and Store engines, too. It has four separate floating-point instruction execution engines, and is designed to fetch and process up to six instructions in parallel each clock cycle. And, of course, the Itanium processors retain full binary instruction compatibility with the previous-generation 32-bit architecture.
[14] Contemporary RISC designs deal with this problem by adding lots more registers for programmers to choose from. Intel designers ultimately addressed this problem in the P6 from a direction that would not require rewriting (or recompiling) existing applications. The use of pseudo-registers in the P6 architecture is discussed later in this chapter.
[15] For a thoughtful discussion of these and other RISC processor design decisions, see Hennessey and Patterson’s Computer Architecture: A Quantitative Approach. Professor Hennessey, who is currently the president of Stanford University, was also a co-founder and Chief Scientist at MIPS Computers, where he designed the first generation of commercial RISC machines.
[16] The major innovation distinguishing the latest-generation Intel Pentium IV processors is a special internal cache for recently translated micro-op code sequences. Apparently, Intel architects discovered that the complicated logic to convert CISC instructions into micro-ops was a major internal bottleneck, leaving the Reservation Station understocked with micro-instructions to be executed. See “The microarchitecture of the Pentium 4 processor” by Hinton, et. al., available at http://developer.intel.com/technology/itj/q12001/articles/art_2.htm for details.
Get Windows 2000 Performance Guide now with the O’Reilly learning platform.
O’Reilly members experience books, live events, courses curated by job role, and more from O’Reilly and nearly 200 top publishers.

