Whether you are preparing static map images for a web page or publishing an interactive web site, MapServer can do the job. Interactive maps allow users to zoom in to particular areas and turn map layers on or off. Applications can be made that let the user select a feature on the map and link it to other data. The possibilities are endless, but the final product is usually a point, click, and view process. The user identifies an area to view or a layer to look at, and the web page is updated with the requested content. If you need a static map, you can save the map for later use.
You can use MapServer from the command line or, for interested programmers, through an API. MapServer also can be used as a common gateway interface (CGI) application or scripted using common web programming languages such as PHP, Perl, Python, and Java. Whether using the CGI version or scripting your own, MapServer's runtime configuration files control what layers are shown and how they are drawn. Mapping data can easily be added to an existing application by editing the configuration file.
This chapter discusses what MapServer is, how it can be used, and how it works. It also covers how to set up the underlying programs that make up MapServer, so it can be used in custom applications. Examples of MapServer application development are given in Chapters 10 and 11.
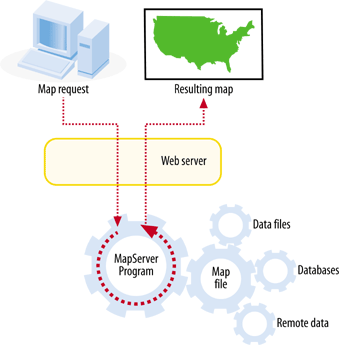
MapServer usually works behind a web server application. The web server receives requests for maps and passes them to MapServer to create. MapServer generates the requested map image and hands it to the web server, which transmits it back to the user. Figure 4-1 shows how the user interacts with the web server which, in turn, makes requests to the MapServer program.
MapServer's primary function is reading data from various sources and pulling these layers together into a graphic file, also known as the map image. One layer may be a
satellite image, another the outline of your country or points showing a major city. Each layer is overlaid or drawn on top of the others and then printed into a web-friendly graphic for the user to see. A good example of the results of the overlapping and mapping process can be seen in Figure 4-2. You can see a satellite image (from a remote server), road lines, and city locations; the city labels are dynamically generated by MapServer.
This drawing process (a.k.a. rendering) occurs each time a request for a new map is made to MapServer, for instance, when a user zooms into the map for a closer look. This process also occurs when a user manually requests a redraw, such as when the content of one data layer changes, and the user wants to see the change.
Get Web Mapping Illustrated now with the O’Reilly learning platform.
O’Reilly members experience books, live events, courses curated by job role, and more from O’Reilly and nearly 200 top publishers.

