The support in rCharts for different JavaScript libraries is very broad, and there are many possibilities for producing beautiful, interactive graphics. Here, we will take a look at just one and peruse the documentation at ramnathv.github.io/rCharts/ to see the different libraries and graphs supported by the package.
The rCharts package is not available on CRAN but can be installed very easily using the following code:
install.packages("devtools") require(devtools) install_github("ramnathv/rCharts")
Let's now take a look at one of the many plot outputs possible with this package:
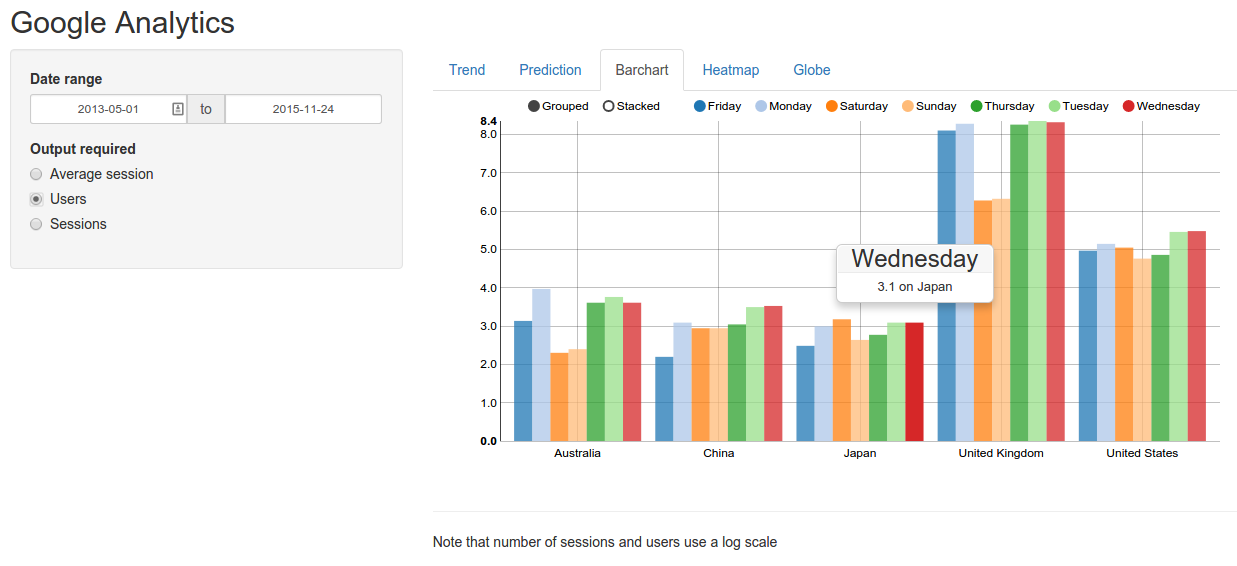
Plot outputs
This plot is a clustered bar chart of ...

