d3heatmap
The d3heatmap package uses vanilla D3 and produces interactive heatmaps. It can be installed using install.packages("d3heatmap"). The output looks like the following screenshot:
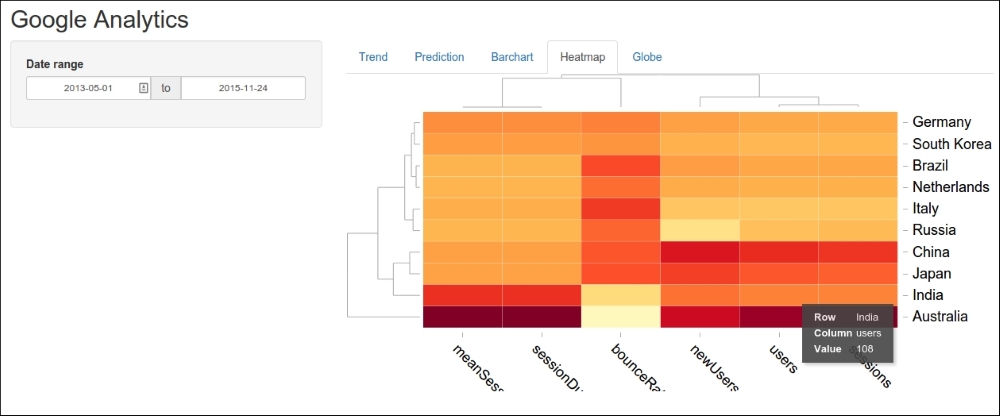
In the preceding screenshot, several variables are plotted (arranged along the x axis) for 10 countries (arranged along the y axis). Mouseover is supported, as shown in the preceding screenshot, with the result for users in India that is highlighted (108). The code is as follows:
output$ui_heatmap <- renderUI({
  d3heatmapOutput("heatmap")
})
The first thing to note that, as discussed at the beginning of this chapter, is that it is necessary to draw the UI in a reactive ...
Get Web Application Development with R Using Shiny - Second Edition now with the O’Reilly learning platform.
O’Reilly members experience books, live events, courses curated by job role, and more from O’Reilly and nearly 200 top publishers.

