rCharts
The support within rCharts for different JavaScript libraries is very broad, and there are many possibilities of producing beautiful, interactive graphics. Here, we will take a look at just one and peruse the documentation at http://rcharts.io/ to see the different libraries and graphs supported by the package.
The rCharts package is not available on CRAN but can be installed very easily using the following code:
install.packages("devtools")
require(devtools)
install_github("ramnathv/rCharts")
Let's now take a look at one of the many plot outputs possible with this package. The final application tab looks like this:
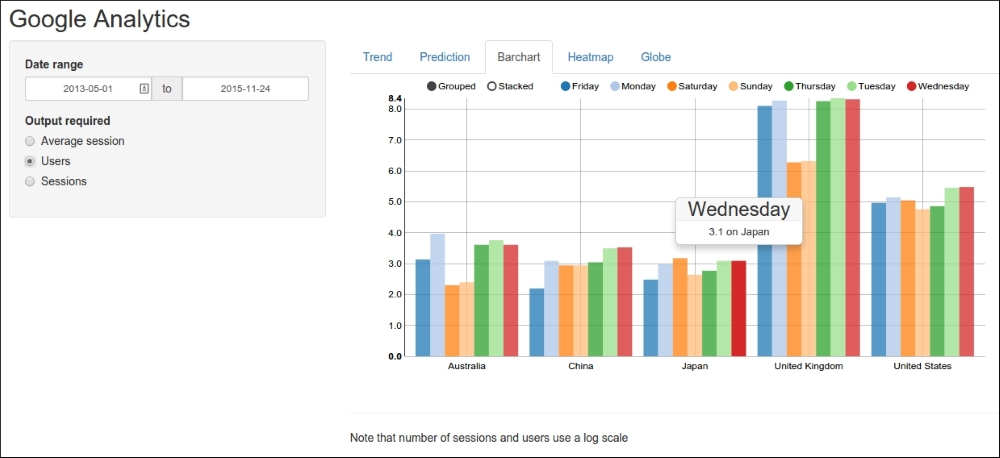
This plot is a clustered ...
Get Web Application Development with R Using Shiny - Second Edition now with the O’Reilly learning platform.
O’Reilly members experience books, live events, courses curated by job role, and more from O’Reilly and nearly 200 top publishers.

