Designing Graphs and Charts
A graph, (also called “chart”), is a visual method for quickly displaying numeric and quantitative information (see Figure 10-1, for example). Graphs provide overviews.
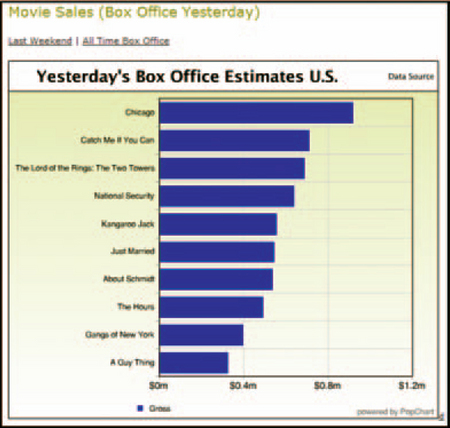
FIGURE 10-1 One way to get data: scrape it.1
This chapter describes the design of graphing software, in terms of both graph parts (labels, axes, symbols, etc.) and the issues you need to address if you want to have useful and usable graphs. But first, a few assumptions and ground rules.
• The graphs described in this section are data driven, not hand drawn. In other words, the graphs are generated from databases or data files of some kind, ...
Get Web Application Design Handbook now with the O’Reilly learning platform.
O’Reilly members experience books, live events, courses curated by job role, and more from O’Reilly and nearly 200 top publishers.

